Monitorama Portland Conference
Four of us were lucky enough recently to visit Portland Oregon to attend Monitorama, a conference geared towards (mostly) Open Source monitoring and related topics. This post is about what our key takeaways were, and the new themes we observed. I had previously attended an as yet unrepeated Monitorama EU in Berlin in 2013 and had found it to be a wonderfully inspiring set of talks.

Key Characteristics
This conference feels different to me to other conferences. Some of the differences are listed below.
Single Track
This works really well for me, as I suffer FOMO massively at other conferences. Being at a single track conference means two things to me: I will focus more because I know nothing else is going on and I know every single talk is going to appeal, otherwise it wouldn’t be on the schedule. Similarly, I won’t be distracted by others coming and going. Seeing the level of audience engagement at Monitorama is great—sure there are still plenty of people focused on their laptop (not all on-call) but it’s a very different picture to some conferences I’ve been to.
Interesting Attendees
The audience of Monitorama feels more like a family than other conferences I’ve been to (except perhaps DevOpsDays). The fact I chatted to three people I met in Berlin four years ago and 5000 miles away shows the audience is loyal. There are a lot of people attending whose day job is monitoring as a supplier, rather than just being made up of consumers. That means you can have some really smart conversations with people. It’s also one of the most diverse sets of attendees I’ve seen and the organisers have set themselves a target to improve this year’s above average 27% women speaker share to 50% next year. A lot of this feels like an outcome of the fact that the conference has grown organically, not commercially.
Great UX
The organisers pride themselves on the experience of attending the conference. So I wasn’t surprised that there were some great bars/restaurants/diners/food-carts/coffee-shops within a five-minute walk from the venue. The venue itself was a great location for a conference, and we felt well looked after. The sponsor stands were unobtrusive and we had some really interesting conversations with the vendors. Their pitches were spread across the schedule explicitly in pairs of five-minute talks so they didn’t merge into one and didn’t overshadow the rest of the talks.
Caring so much about the experience of the location and venue is part of the reason why the European variant hasn’t been repeated (yet), but makes it all the more impressive that when an underground electrical fire struck on Monday evening the organisers calmly scoped out an alternative venue, dropped $11k for one days rental and started the second day of the conference with seating for 550 people bang on time, with AV equipment and assistance provided by the original venue and still live-streamed (to 4,647 viewers). As you can imagine, many references were made to this achievement, and to the hilarious irony of a talk from the previous day referencing the ongoing 55-year underground fire in Centralia, Pennsylvania.
Plenty of social opportunities
I feel much of the value of a conference are the social connections you make and conversations you share about others’ experiences in their day jobs. This is especially important at conferences where people might have travelled solo and not have anything to do in the evenings.
The vendor parties were great, with Sensu providing drinks & food based hospitality at a local bar and Grafana Labs providing free games at Ground Kontrol, a local retro gaming arcade. Here we discovered the only ten player arcade game in the world—Killer Queen.
Although we didn’t partake, it was refreshing to see an organised local tour and a hike bookending the conference—something wholesome and a healthy way to make some friends.
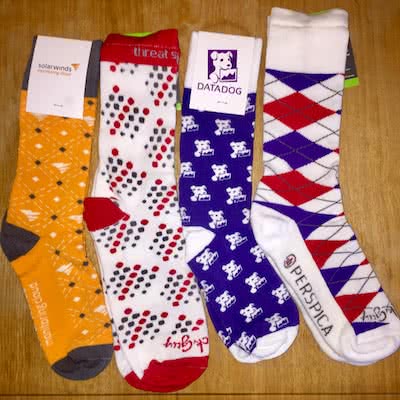
Socks
Monitorama is the home of sock swag, and it’s great to see that vendors have followed the conferences example by offering branded socks—much less straight to landfill stuff, and everyone needs socks!
Themes
Observability
Quite early on Charity Majors talked about observability, building on the themes from a talk last year by Greg Poirier named ‘Monitoring is Dead. Long Live Monitoring’. There followed a lot of references back to observability and it is great to see that organisations have started to invest significant effort to address observability as part of the delivery process (vs monitoring as an afterthought). In Greg’s great talk he presents this description of observability:
A system is observable iff you can determine the behaviour of the system based on its outputs.
I came away feeling that we need to invest more effort ensuring that observability is considered as a core requirement of systems that we build so that we can rely less on rudimentary synthetic monitoring which can’t do much more than telling us that something is wrong.
OpenTracing
We’ve been trying to improve visibility of our distributed systems at Auto Trader for a couple of years, providing a Java filter which can be easily added to applications to provide request correlation identifiers as response headers and allow developers to pass them on as request headers (available via a thread-local store) to the services that their application talks to. We’ve made limited progress, most likely because the incentive hasn’t been there—we haven’t had the ‘carrot’ which provides the benefit of this practice until recently (these identifiers are stored against metric measurements and application logs in our Elastic Stack set up).
So it is fantastic to hear so many companies talking about their progress adopting an open standard around tracing between hypermedia APIs and other systems such as databases and potentially other third party off-the-shelf systems. This sort of technology has been available for some time in expensive proprietary monitoring platforms but we didn’t fancy dropping £2m/year on something that didn’t want to integrate with other open-source monitoring technology.
It seems that there is a lot of activity in this area and open-source tools like Zipkin and Jaeger are available to provide you with somewhere to collect and understand the trace telemetry that is generated.
The basic concept is that in a complicated service architecture where one system is producing errors impacting all upstream clients, you can quickly use the graph of calls between those systems observed from the trace telemetry to understand where the fault is actually occurring, despite the fact that a number of services are showing as unhealthy.
Culture
It was nice to hear plenty of discussion around the importance of culture when attempting to improve the operational position of your organisation, and not just discussion but some takeaways as well. This reinforced a number of realisations recently that our operational tribe need to do more to understand the context of use of the systems we provide and find more ways to build a feedback loop with our customers.
Histograms & Distributions
As before at this conference there was a lot of good discussion of the importance of understanding the shape of your data—much of it will follow distributions which can not be accurately understood using a high level sampled aggregate of the data such as the average value.
The majority of monitoring out there in the wild is guilty of hiding this detail, and even tracking the median along with a number of percentiles is not a great approach. It was interesting to hear that more products are looking at supporting the storage of histograms rather than individual values—using more storage but providing more insight into how the data points are distributed over time. Yes, some products have been doing this for some time but for those of us who have stuck to free (as in both beer and speech) products, this has not typically been easy to achieve.
We will be looking into addressing our current time-series database shortly and this will factor into our decision making progress.
Open-source
There was a great deal of discussion about the merits of open-source and open standards, and it struck me that a lot of people have been doing a lot of fantastic work to improve the toolsets available, rallying behind the #monitoringlove movement. We are indebted to them.
Stand out talks
- Martyrs on Film: Learning to hate the #oncallselfie—Alice Goldfuss Alice made a strong argument that if you didn’t already have your developers on call, then that should be the first thing that you tackle when you get back to work. She talked about her experiment with tweeting a selfie every time she was paged while on call and argued the importance of actionable alerts.
- Linux debugging tools you’ll love—Julia Evans Julia creates amazingly accessible comic style instruction manuals that you will probably recognise. She demonstrated (live) three different approaches to debugging problematic processes in an incredibly entertaining way, using techniques you probably have available to you and haven’t thought to use.
- The Vasa: Redux—Pete Cheslock If you haven’t heard Pete telling the story about the Vasa then this is a very entertaining presentation which wrapped up the first day. Who would have thought the modern problem of scope creep and technical debt would be foretold hundreds of years ago in the world of shipbuilding.
- Distributed Tracing: How We Got Here and Where We’re Going—Ben Sigelman Ben talked about how much progress has been made in the field of tracing distributed transactions, with some interesting ideas around making contention observable using identifiers as part of your approach to tackling tracing. This is a fascinating idea that we will definitely be looking at once we have tackled the basics of tracing.
- UX Design and Education for Effective Monitoring Tools—Amy Nguyen Amy gave a fantastic talk which really resonated with me, working in a team at Pintrest whose customers are internal engineers. She argued that it was important to apply the same principles we do to product UX to our internal systems, considering ease of use, measuring customer satisfaction and especially engagement.
- Automating Dashboard Displays with ASAP—Kexin Rong Kexin had never spoken at a technical conference before, working in an academic background and yet she gave perfectly structured and well-delivered talk about how you can apply a mathematical technique to a problem that you probably would recognise but haven’t thought much about—how to apply smoothing (think moving averages) to a data series to show the overall trends without over smoothing and hiding the actual details. If you’ve ever plotted something like CPU on a chart over a day and got a very spiky mess which you can’t interpret, you’ll be pleased to hear that Graphite should hopefully have a built in function which can effortlessly help you.
- Distributed Tracing at Uber Scale: Creating a Treasure Map for your Monitoring Data—Yuri Shkuro Yuri gave us an interesting perspective on why Uber have heavily adopted OpenTracing and showed us Jaeger—a powerful OpenTracing implementation. Uber found that with around 2000 micro-services, it was no longer possible for one person to negotiate the organisation’s architecture to perform diagnostics when there is something wrong. There is simply too much complexity to expect a person to hold in their head at once. Now they can visualise their architecture using Jaeger. There is a good demo you can quickly get running with some sample applications running under Docker to show the advantages.
Take aways
Out of hours support
We have discussed the idea of having our product squads providing support out of hours for their systems, yet this is something that we have made limited progress on. I believe we need to look seriously at what we need to do to achieve this for all the reasons Alice Goldfuss discussed. A good point was made that you need to have the right tools in place to allow teams to take responsibility for the support of their systems, otherwise their limited visibility and lack of context will cause significant frustration and confusion when more than one system is affected.
Open Tracing
We have already started looking at how we can incorporate what we have already done with traceability with the OpenTracing standard, and consolidate the approach of something like Jaeger with our existing Elastic Stack set up. We believe that providing this information to our support teams is going to revolutionise the way we operate our environment, simplifying diagnostics and allowing us to rub out the massive hand drawn architecture diagram that sits behind our first line support team.
Alternative ES hosting providers?
It was interesting to see some alternative providers of Elasticsearch/Elastic-Stack-as-a-service out in the vendor area. It was also interesting to hear that we are not alone in struggling to scale Elasticsearch. Paul Fisher at Lyft spoke about their heavy use of Elastic in their logging infrastructure, and fascinatingly mentioned a setting we had not heard of before, controlling how often Elasticsearch flushes to disk. We were able to quickly confirm that this reduced our disk operations by 75%, although the trade-off is that you risk data loss (fairly palatable within reason when dealing with logs), which can then be somewhat mitigated by setting a shortish sync interval.
Arcade game in the office
Killer Queen was an awesome game and has inspired us to look into adding an arcade game into our current office games area refit. Sadly we don’t have the space for a Killer Queen console.
Health Checks
Talking to a few people it seems like no one is aware of any efforts to share best practices around application health checks and to converge on an open standard for the JSON payload that a health check might return. This is an interesting idea because if we can standardise the response we can start to build shareable systems to provide visualisation and alerting based on synthetic testing of service health across the environment.
Who should go
Operations and developer folk who are interested in working with observable software and learning about the tooling providing functionality around visibility, searchability, machine learning analysis of and storage of application instrumentation (metrics, logs etc). No need to be highly experienced, and no need to worry about attending alone.
Still not convinced? There are 164 videos from previous Monitoramas on Vimeo today and those from this year are already there.
Enjoyed that? Read some other posts.
Related Posts
05 Oct 2023—Tim Summerton-Brier, Stevie Woods, John Harrison
Photo by Tico Mendoza
Back in April, Auto Trader gave a few of us the opportunity to attend Data Council 2023 in Austin, Texas, USA. Data Council is an independently curated conference that covers many aspects of working...
