How we halved page load times using Tree Shaking and Ahead Of Time Compilation
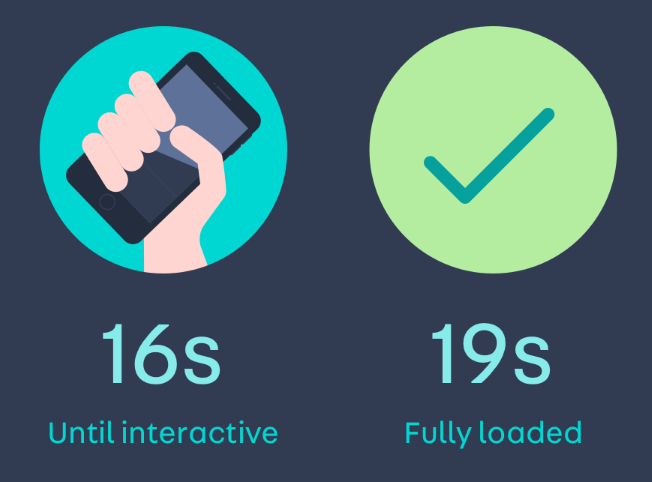
In March 2017 we released a new homepage for our trade users using a new client side technology framework utilising a Component based Angular 2 structure. Currently, measurements of our users’ page load speed tell us that 75% of users see a fully loaded page in under five seconds with 50% loading the page in three seconds, but it hasn’t always been this way. Initial measurements using Google Chrome’s Lighthouse performance benchmarking tool saw page load times of ~19 seconds on mobile devices on 3G and 10 seconds on a desktop broadband connection. Using Lighthouse as a benchmark we set out to reduce page load times for mobile devices on 3G to under 10 seconds.
Page load speed is a big issue for web development with Google’s research suggesting that a page that takes longer than three seconds to load can lose up to 53% of its visitors. Current data on the average page load time across the web suggests the average is far greater than the three-second target. Research performed in Double Click’s Mobile Speed Matters report suggests that the average mobile site takes 19 seconds to load and 75% of sites take more than ten seconds to load on mobile devices.
For our web app, connected to our internal network, navigation to the new homepage took between 10–12s. On a 3G connection (750kb/s down, 250kbps up) the figure rose to 19–22s. The first issue we identified was the size of the bundles we delivered to the user with a combined (pre-zipped) size of 3MB for both our JavaScript bundles. This size led to a time to download and unzip of ~seven seconds each:


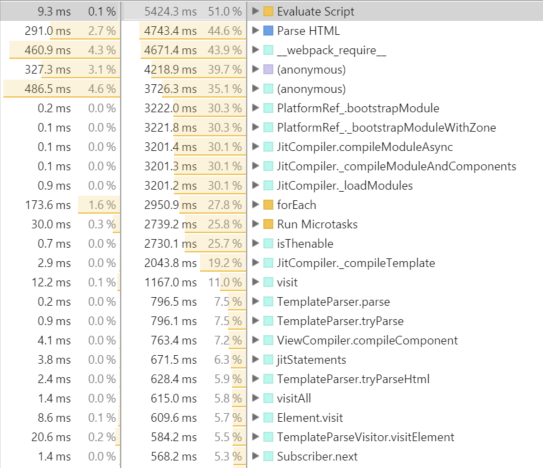
The second issue we identified was the time it takes for the Angular just-in-time(JIT) compiler to parse the Angular specific JavaScript and HTML and process it into raw JavaScript. This is constrained by CPU speed rather than network speed and so added around five seconds to the time taken to load the page for users regardless of connection speed. As can be seen from the call tree, of the five seconds it takes to evaluate the script and parse the HTML, bootstrap and JIT compilation functions take up the vast majority.
Performance Measurement
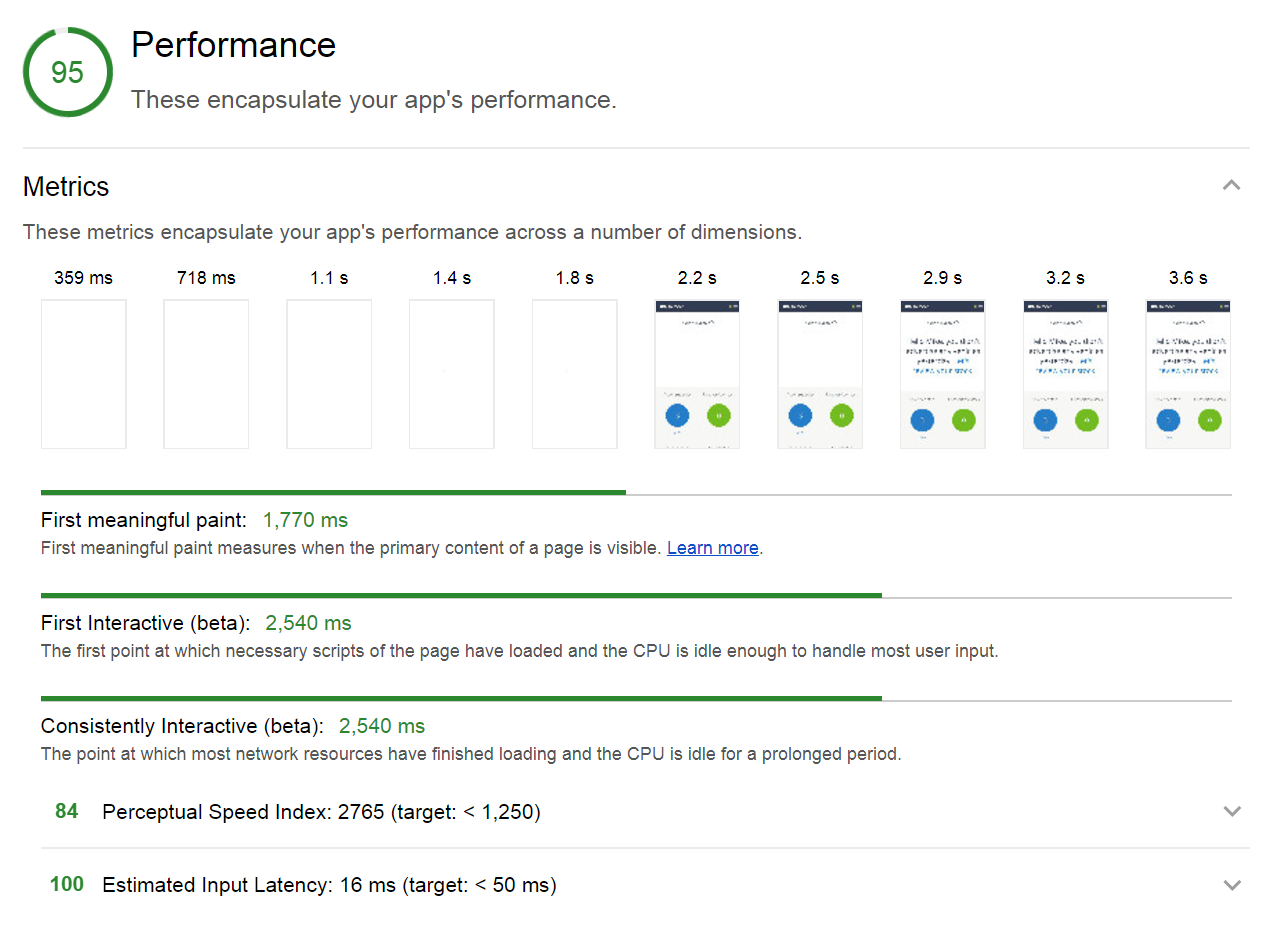
To ensure a consistent measurement of improvement we used Google Chrome’s Lighthouse tool for measuring the performance of our web app. By default, Lighthouse emulates a Nexus 5X, with a 3G connection and CPU throttling. This would be a worst case scenario for our user’s but allows us to illustrate how even small changes to the build process can improve page load times. Its measurement of performance is broken down into five metrics:
- First Meaningful Paint - This is a measurement of the time at which the primary content of the page is visible.
- First Interactive - This is a measurement of at what point the compulsory scripts of the page have loaded.
- Consistently Interactive - This is a measurement at what point most of the network calls are complete and the CPU is idle.
- Perceptual Speed Index - This is a measurement of how quickly the contents of the page are populated.
- Estimated Input Latency This is a measurement of the time the page takes to respond to user input.
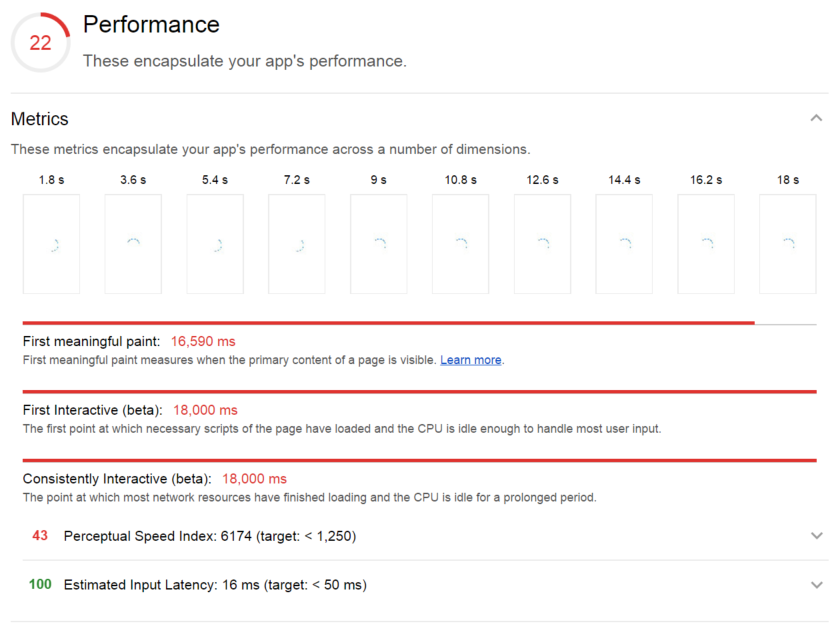
The initial measurement of performance was as follows:
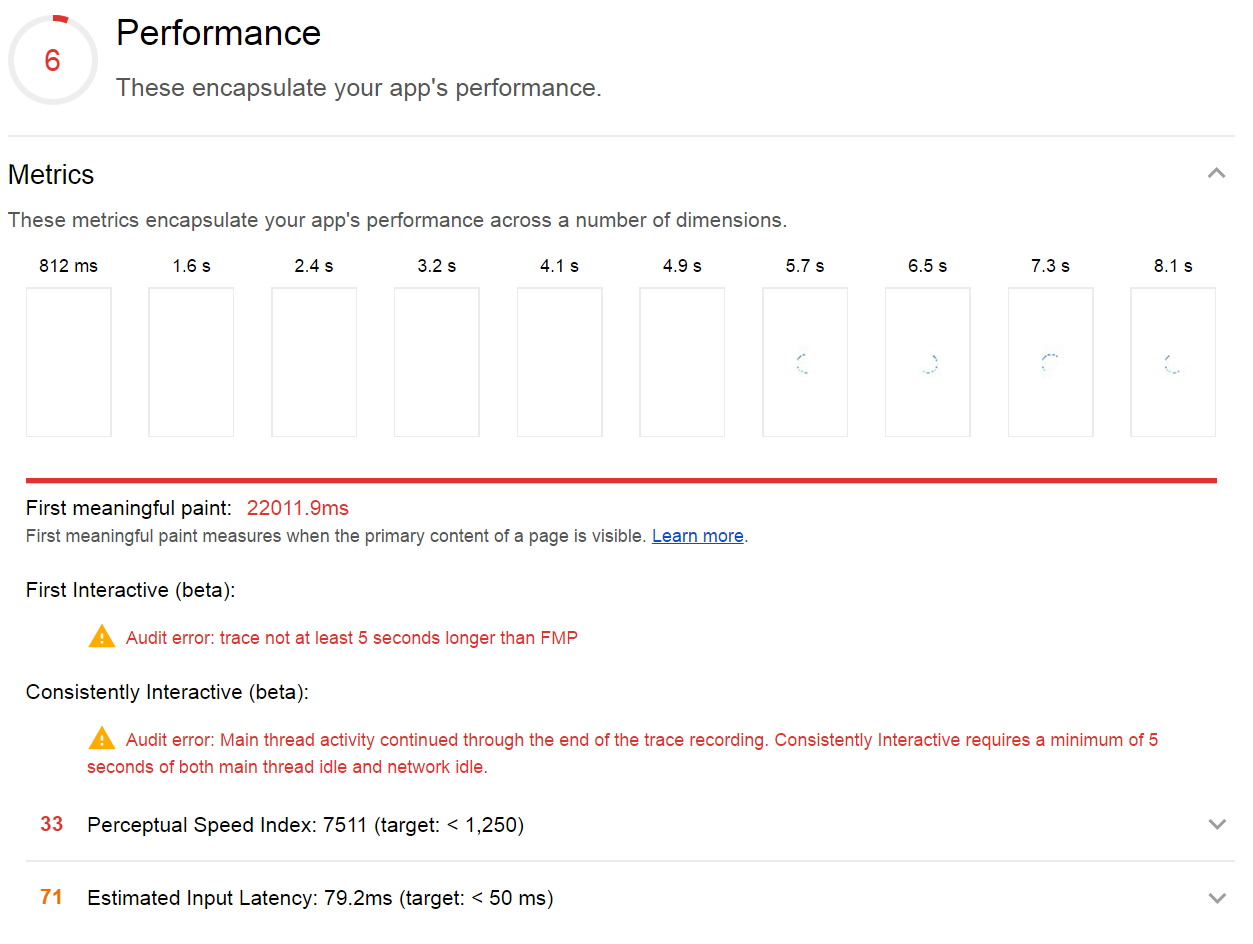
Our performance was rated at 6/100 taking 22 seconds to first meaningful paint and due to how long it took for calls to be resolved, Lighthouse was not able to generate a measurement for First Interactive or Consistently Interactive. To work towards an improved score and better page performance we broke our approach into three steps. First of all, we wanted to tackle bundle size using tree shaking to eliminate unused code. Secondly, to upgrade from Angular 2 to 4 bringing a new compiler with improvements to the size of generated output. Finally, to replace just-in-time compilation with ahead-of-time (AOT) compilation removing the need to serve the compiler to the client and compile the Angular code in the browser.
Webpack 2 and Tree Shaking.
Our initial build process used Webpack 1 with basic uglification and minification to reduce the size of the JavaScript we served to the client. However, even with this in place, we were still serving around 3MB of JavaScript to the client on page load. Upgrading to Webpack 2 gave us the ability to use ES6 modules. For all application code plus any libraries written in ES6, Webpack is able to identify code that is not used and mark it for deletion. Running Webpack in production mode will instruct it to run UglifyJS which removes any of the code marked for deletion from the final bundle. We saw immediate improvements from this, but, there were a few libraries still bringing more than required into the bundle.
RxJS
RxJS is a very large library and added a lot of weight to the vendor bundle but is required for Angular. Specifically, we use the Angular http library to make requests and this uses RxJS internally for those. If RxJS is imported into an app in the form:
import Rx from "rxjs/Rx"
or
import { Observable } from "rxjs/Rx"
every operator provided by RxJS will be included in the output bundle even if only a few are used in the app. This is due to the way the entry file in RxJS works. The main file, Rx.js, imports every single operator within the library. When Webpack scans to find unused code it sees that it is being used in Rx.js which is in turn used in our application code and so assumes it needs to bring in every operator. To remove these we needed to only import the specific operators required from Rxjs. For example in a file that looks like the following:
import { Observable } from "rxjs/Rx"
.
.
.

Observable.forkJoin(observableOne, observableTwo).flatMap((results)) => {
    return Observable.of(new CombinedResult(results[0], results[1]));
}).catch(err) => {
    return Observable.throw(err);
});
would need to be replaced with:
import { Observable } from "rxjs/Observable";
import "rxjs/add/observable/forkJoin";
import "rxjs/add/operator/mergeMap";
import "rxjs/add/observable/throw";
import "rxjs/add/observable/of";
.
.
.

Observable.forkJoin(observableOne, observableTwo).flatMap((results)) => {
    return Observable.of(new CombinedResult(results[0], results[1]));
}).catch(err) => {
    return Observable.throw(err);
});
Making this change throughout an app will cut down the impact RxJS has on bundle size dramatically.
@ng-bootstrap
We use @ng-bootstrap for two components within our app: dropdowns and modals. After tree shaking, every component in @ng-bootstrap was still appearing within our bundle. In the same way as RxJS the entry point in ng-bootstrap, index.js, imports every component. Again, Webpack believes all of the components are used within the app. To fix this we needed to change the way we import @ng-bootstrap’s modules into our application. Previously, we did this in the following way:
import { NgbModule } from "@ng-bootstrap/ng-bootstrap";

@NgModule({
    imports: [
        NgbModule.forRoot()
    ]
})
To ensure the only components included in the bundle were the ones used in the app, we replaced this with:
import { NgbDropdownModule } from "@ng-bootstrap/ng-bootstrap/dropdown/dropdown.module";
import { NgbModalModule } from "@ng-bootstrap/ng-bootstrap/modal/modal.module";

@NgModule({
    imports: [
        NgbDropdownModule.forRoot(),
        NgbModalModule.forRoot()
    ]
})
ES5 Libraries
Some libraries do not produce ES6 compatible modules which can be used with tree shaking. Webpack does provide a way of discarding parts of these libraries using the Webpack ignore plugin. Given a regular expression, if an import or require is found matching it, the ignore plugin will instruct Webpack not to include the module in the output bundle. An example of one of these libraries producing ES5 modules is the Moment library which provides locales alongside its date library which we don’t require in our application. To remove this part of the library you can use the ignore plugin as follows:
new webpack.IgnorePlugin(/^\.\/locale$/, /moment$/)
Result
The result of making these changes led to a 56% reduction in the amount of JavaScript we were delivering to the client and improved download times for the JavaScript bundles on a 3G connection by 44%.


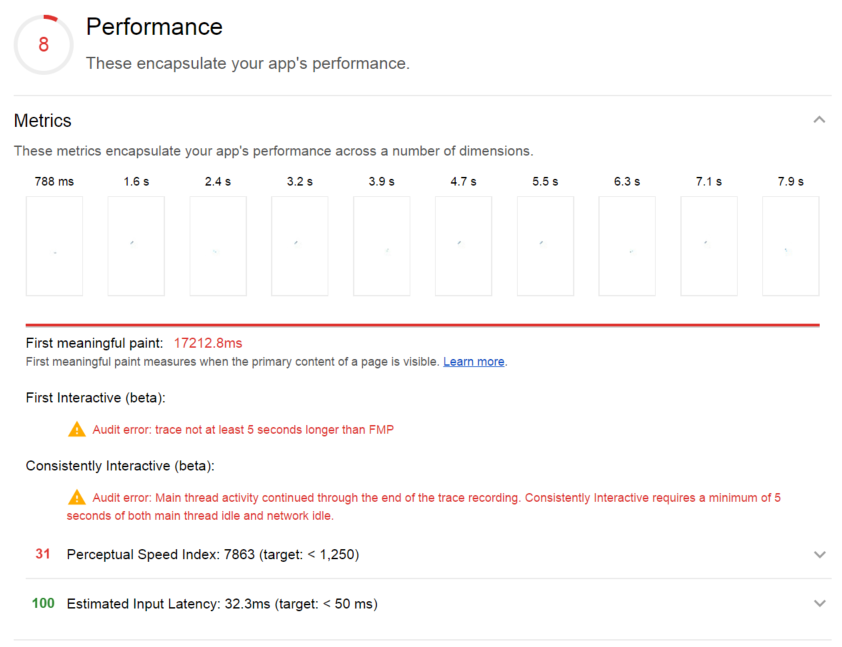
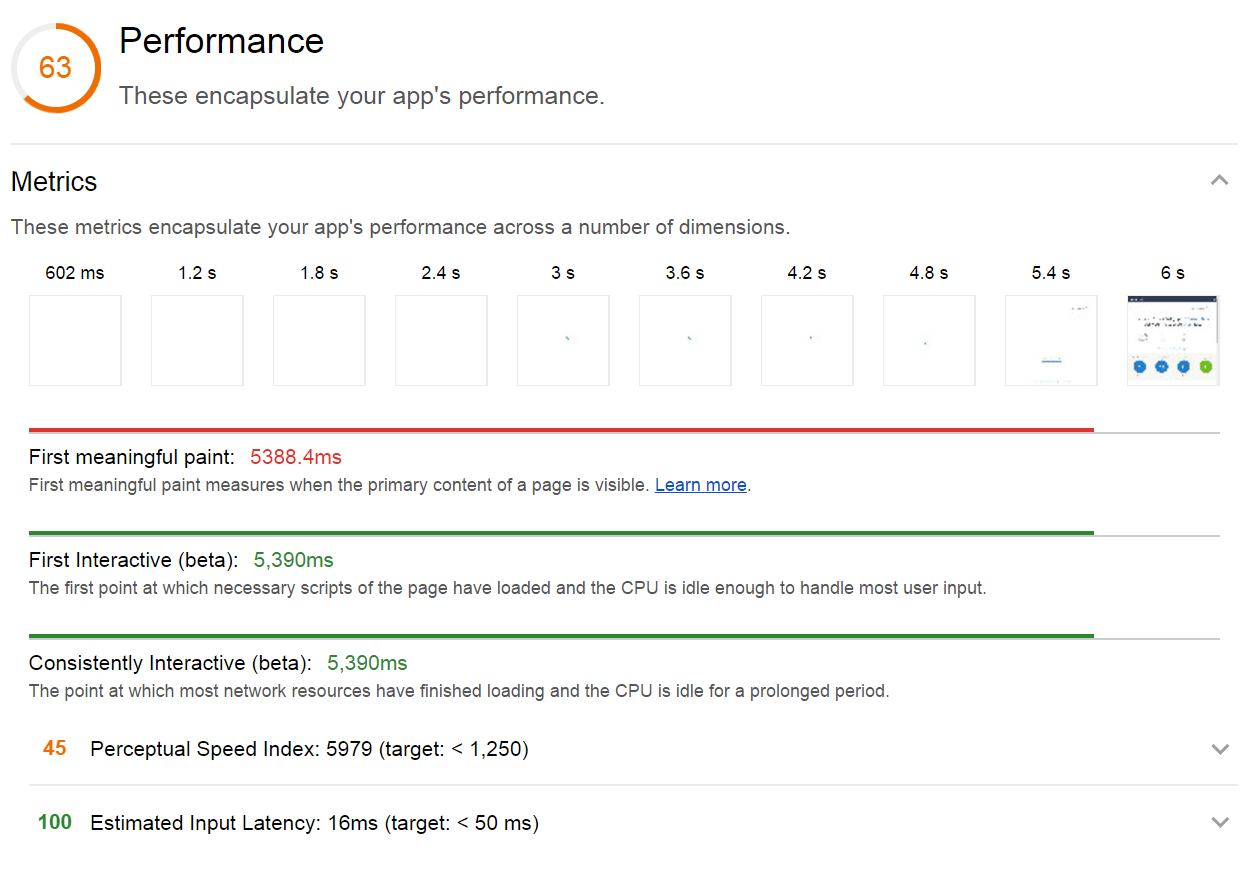
Running Lighthouse with these changes reduced page load times on a mobile device running on a 3G network by around five seconds:
We also saw major improvements on load times on desktops running on our internal network. Running Lighthouse with mobile and network emulation disabled gave us a result of around 6 seconds for first meaningful paint:
Angular 4
The next step in improving performance was to upgrade to Angular 4. Angular 4 was packaged with a number of performance improvements to speed and bundle size. This was a very simple change to make with only a few features of Angular 2 deprecated in Angular 4.
Result
Although the result of upgrading to Angular 4 was small we did notice a small difference in load times and reduction in bundle sizes. Our vendor bundle, which includes Angular’s code, was reduced by 0.1mb.


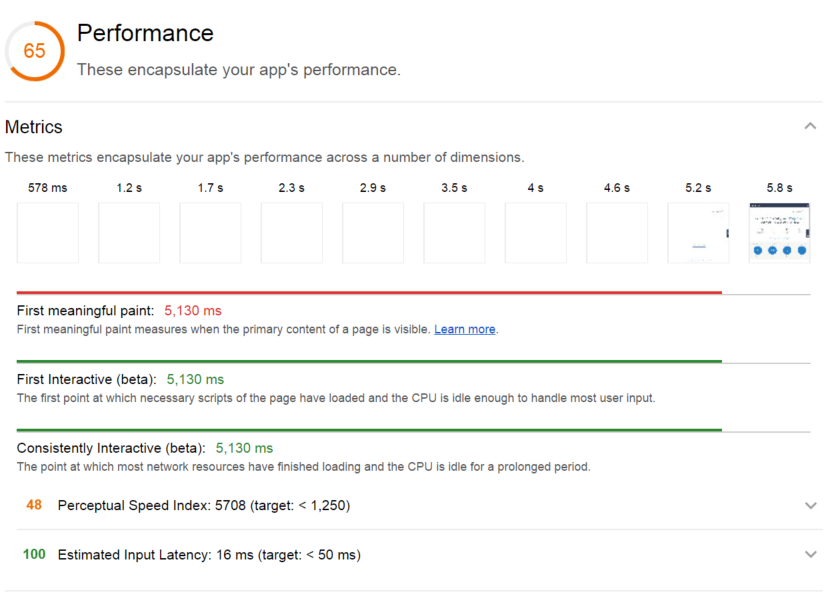
Running Lighthouse with these changes reduced page load times on a mobile device running on a 3G network by around 1–2 seconds. At this point we are also able to have all scripts on the page load quick enough for Lighthouse to get measurements for first and consistently interactive, greatly improving our score for performance.
We also saw small improvements on our internal network with a reduction in page load time of 0.1–0.5 seconds.
Ahead of Time Compilation
The final step was to replace just-in-time compilation with ahead-of-time (AOT) compilation. This has two improvements on page load speed. Firstly, by compiling the Angular code before delivering it to the client, the compiler does not need to be delivered as part of the vendor bundle. The size of the compiler is around 20% of the bundle so this is a substantial size reduction. Secondly, a large reduction in the amount of CPU time required to get the page loaded as the browser need only parse the raw javascript and HTML rather than the initial compilation step.
In its simplest form to produce AOT compatible JavaScript you replace the typescript compiler “tsc” with the Angular compiler “ngc”. As we use Webpack to produce our bundles we needed this to run as part of our bundling. There are several approaches to this but we used the “@ngtools/webpack” plugin produced by the Angular-cli team. This replaces, in our case, both the typescript loader and angular-template-loader we previously used in our Webpack config for loading typescript files and Angular templates.
    test: /\.ts$/,
    use: ['awesome-typescript-loader',  'angular2-template-loader'],
    exclude: [/\.(spec|e2e)\.ts$/]
becomes
        test: /\.ts$/,
        use: '@ngtools/webpack',
        exclude: [/\.(spec|e2e)\.ts$/]
To make our app compatible there were several things we needed to change. Firstly, we needed to update our tsconfig to use ES2015 modules and to include the ES2015 and dom libraries. We also required some Angular ahead-of-time specific options: "angularCompilerOptions": { "genDir": "compiled", "skipMetadataEmit": true} which tells the Angular compiler where to put the generated Angular compiled JavaScript and to avoid emitting any metadata. The metadata files produced by the AOT process are required when building AOT compatible libraries. Applications using these libraries can use this metadata to construct the final browser ready JavaScript. As this is a webapp rather than a library we do not need to produce this metadata.
Following this, we replaced our main.ts file used to bootstrap our Angular code. This previously was in the form:
import { platformBrowserDynamic } from "@angular/platform-browser";
import { MainModule } from "./main.module";

enableProdMode();

platformBrowserDynamic().bootstrapModule(MainModule);
import { platformBrowser } from "@angular/platform-browser";
import { enableProdMode } from "@angular/core";
import { MainModuleNgFactory } from "../../../compiled/src/main/client/main.module.ngfactory";

enableProdMode();

platformBrowser().bootstrapModuleFactory(MainModuleNgFactory);
The bootstrapModuleFactory function is used rather than thebootstrapModule function when bootstrapping our app using the Angular generated main.module.ngfactory. This tells Angular that it should use precompiled JavaScript files rather than compiling on the fly. This file does not exist until the Angular compiler has run so it is important to exclude this file within the tsconfig to ensure builds don’t fail! Finally, we must instruct the AotPlugin provided by @ngtools/webpack in our webpack configuration where it can find both the new tsconfig and the new entry module:
  new AotPlugin({
            tsConfigPath: path.resolve(__dirname, "../tsconfig-aot.json"),
            entryModule: path.resolve(__dirname, "../src/main/client/main.module.ts#MainModule")
})
External Libraries
Any external libraries used in the project which produced Angular Components or Directives needed to also produce AOT metadata files to be used within an AOT project. There were only two libraries in our project that didn’t do this. Firstly our internal component library which we were able to upgrade ourselves to produce AOT compatible code. We also use ng-chartist for charting. This library didn’t produce metadata files as part of its build process, luckily the owner was open to a contribution to fix it and we were able to add the build step to produce ahead-of-time compatible metadata files. To produce AOT compatible libraries the typescript compiler “tsc” is replaced with the angular compiler “ngc” with an option set in the tsconfig to only generate “metadata.json” files. When the library is included in an application compiling with AOT it can use this metadata to generate the compiled JavaScript from the libraries components and directives.
The Results
With these three steps completed, we saw major improvements in our scores from Lighthouse. In the 3G tests on a mobile device, we saw page load times down to ten seconds and below.
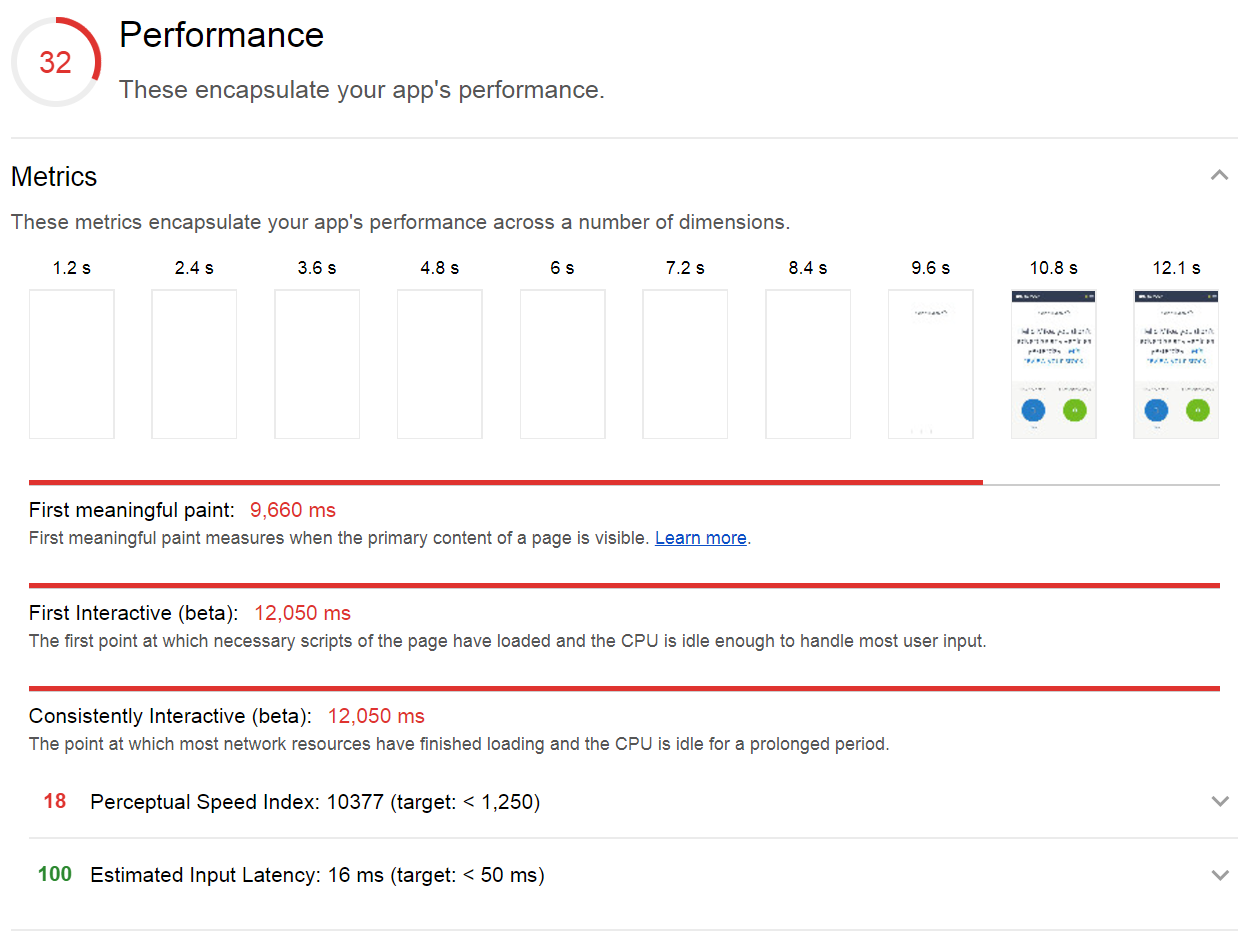
And on our internal network, we saw major improvements with page load times down to around the three second mark.
After we had completed the improvements to the page we used an implementation of Yahoo’s Boomerang library to monitor real world page load speed of our users. The initial results of this are very promising with 25% of users seeing a page load speed of two seconds and under, 50% three seconds and under, 75% five seconds and under and 95% under ten seconds. But there is still more work to be done!
The Future
Some of the biggest potential improvements could most likely come from Googles TSickle project. This is able to produce code acceptable to the Closure Compiler from Typescript but is still in early stages of development. This is desirable as it outputs even more concise JavaScript from your source. Results using this elsewhere have seen a reduction in bundle size of up to 150%. We are also beginning to integrate progressive web app features into our applications such as the app shell and service workers giving us a much improved time to first meaningful paint. This also brings support for offline mode meaning our users will never get a blank screen even when they lose connection! As we go forward we would like to monitor the speed of our pages over time to ensure we don’t cause a regression as we add more features. Lighthouse itself supports integration into a CI environment and integrating this into our build process would ensure we catch any speed regressions in the future!
Enjoyed that? Read some other posts.
