How buyers are affected by an AI-driven product: Price Indicator
Artificial intelligence (AI), is the ability of machines to learn from data. Often, this data is derived from human interactions. In this blog, we will explore how Auto Trader has used AI and Machine Learning (ML) to directly influence the buyer’s and seller’s experience.
An exciting day for Charlie…
We’re going to tell our story through our hypothetical car buyer, Charlie. Like many other people today, Charlie seems to do everything online, including buying a car.
As it happens, Charlie has finally decided to buy a car. They visit the Auto Trader website and, after a few clicks, are already looking at some Audi A3 TFSIs. Perfect for the daily commute to work!
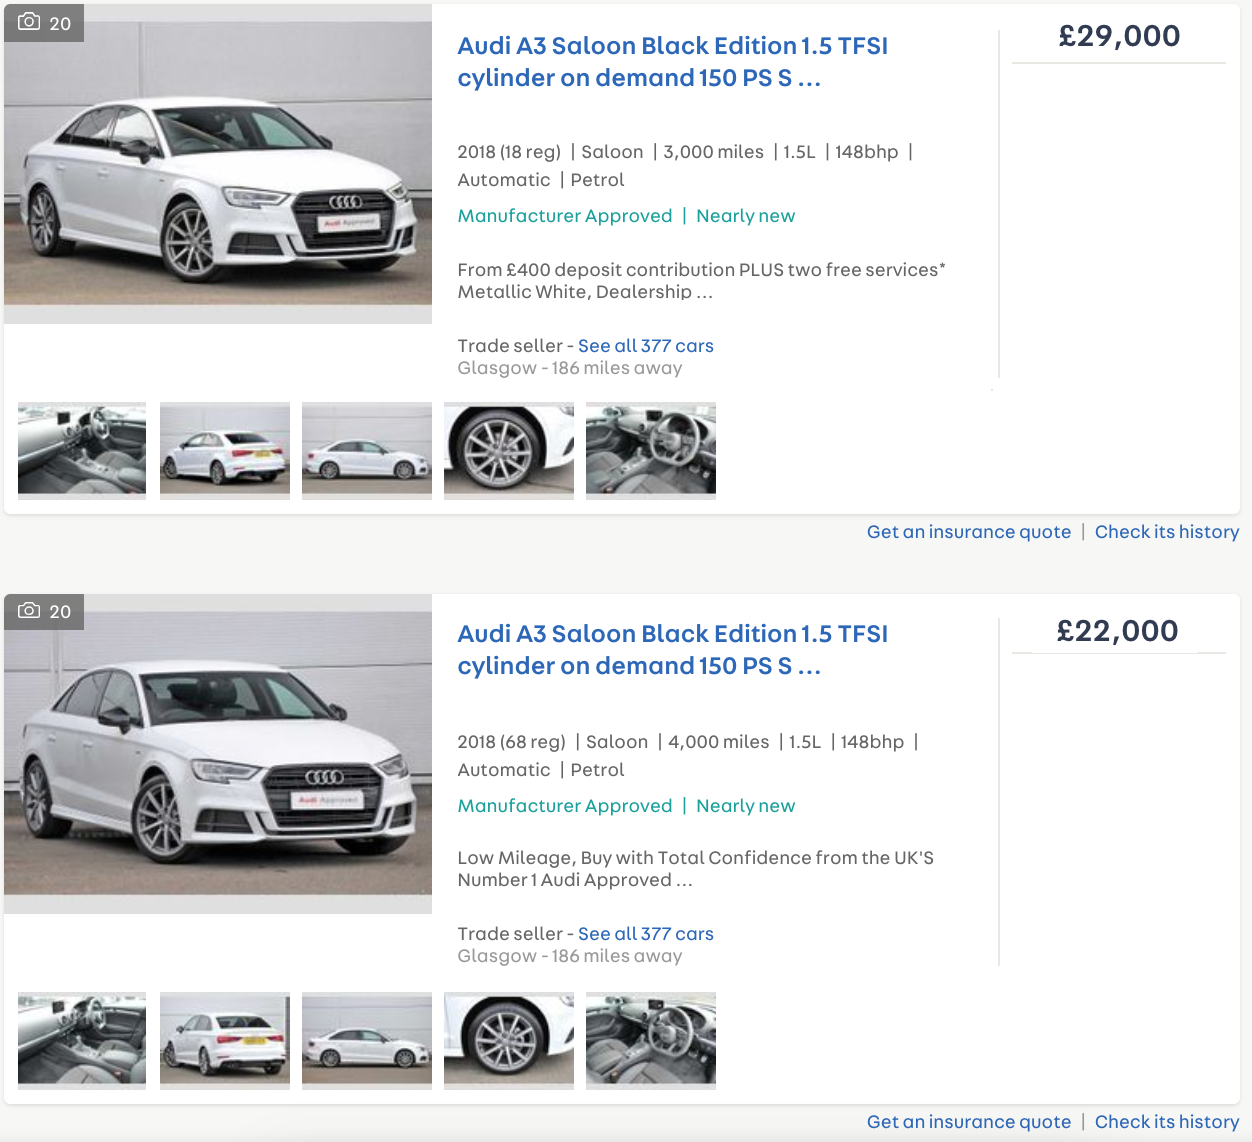
Please note that these adverts aren’t real!
Charlie has found two cars that look very similar, with almost identical specification, but with a significant difference in price. What are Charlie’s thoughts? The figure below demonstrates potential thoughts a user would have on his/her car buying journey.
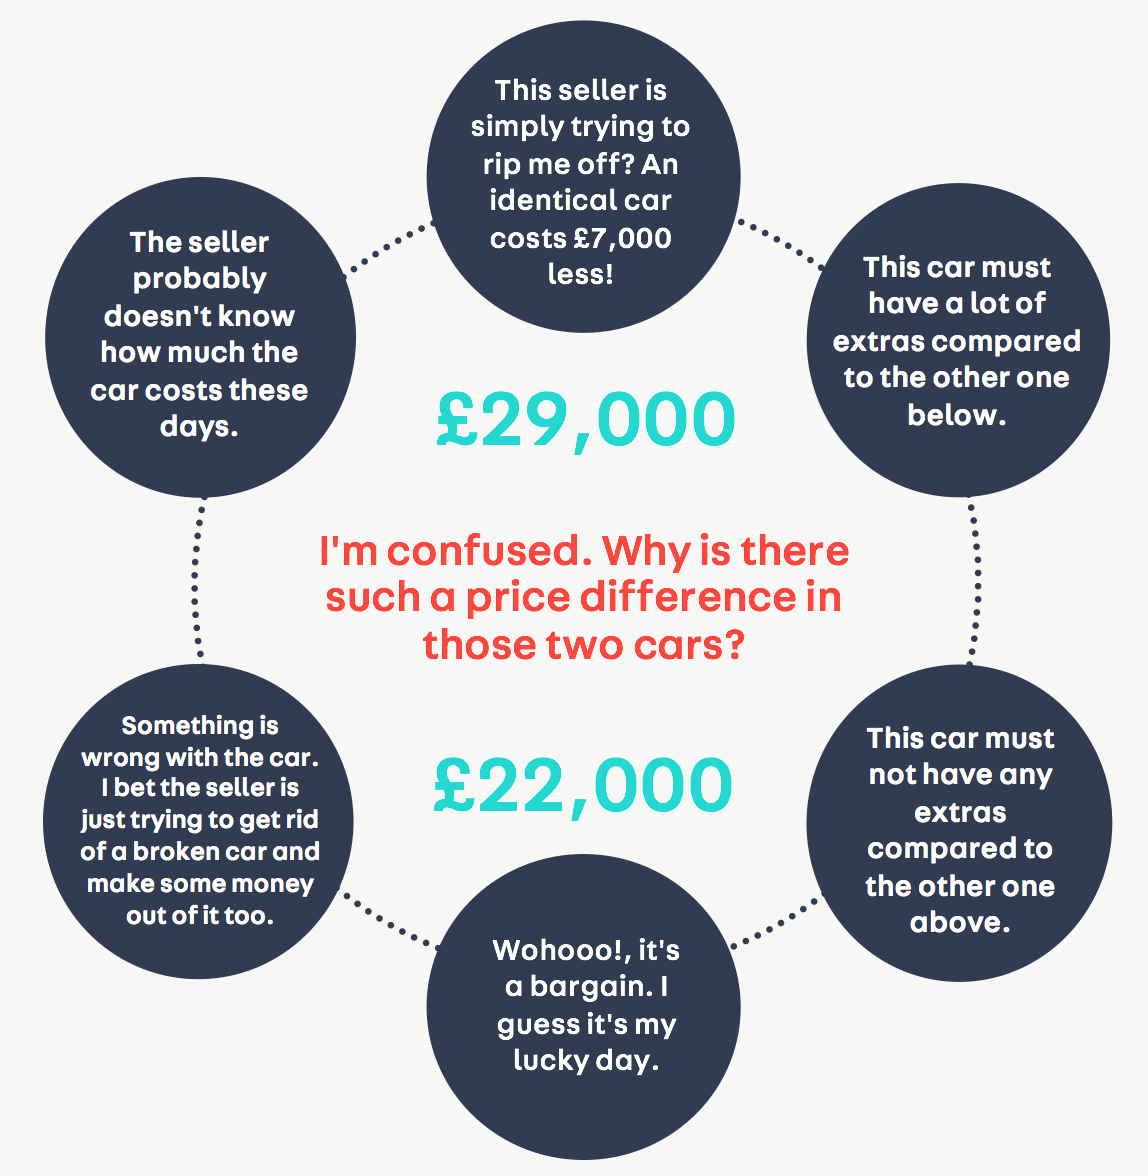
At this point, Charlie’s thoughts are based on conscious or unconscious biases concerning the seller’s ability to price the advertised car at a fair price.
Charlie’s next step to reach an accurate and informative decision could be to carry out exhaustive research to find and inspect all similar cars. Auto Trader serves around 500,000 car listings. Users can narrow down their search results by applying specific criteria. In this case that would include:
- Make: Audi
- Model: A3
- Model Variant: TFSI
- Body Type: Saloon
Since the search criteria are quite specific, the car listings were reduced to a more manageable 388 adverts; this could potentially allow Charlie to manually review all of them. However, the more cars are available, the more comparisons Charlie will have to perform. This has proven to be a tedious task for quite a lot of our buyers.
One fifth of recent car buyers found vague, hard to find or misleading information in their recent research to buy a car, with over a third claiming they delayed or actually put off buying altogether. Auto Trader market report 2016.
Maybe not so exciting after all…
Charlie, having realised the complexity of reaching such an informed decision, is now no longer excited.
So what’s the answer? Are the vehicles priced reasonably or not?
The truth is, no one knows the exact state of the market at a given time, for all similar vehicles and vehicle conditions.
What does that have to do with Artificial Intelligence or Machine Learning?
Well, what if we could build something that would give Charlie an indication about whether the advertised car is reasonably priced? What if this something could give Charlie a grasp of what the market looks like for any given vehicle, and more importantly, let Charlie remain excited?
Auto Trader valuations
We observe over 12,000 price changes and nearly 20,000 cars that are added or removed, every day, on site. Our valuations provide a clear view of the market and what a car, compared to similar vehicles, could be worth.
We combine and analyse data from a number of sources, including:
- Over 500,000 ads on Auto Trader and dealers’ own websites
- Price data from major car auctions
- Information on fleet and leasing disposal prices
Our valuations play back what’s in the market so—because the used-car market changes quickly—we update them every day.
Price Indicator
Price Indicator (PI) is based on Auto Trader valuations and is both a buyer and seller facing product. PI can take the form of three types of flags to provide a view of how competitively cars are priced in the market.


Auto Trader will award an advert a PI flag only if the advertised price falls into one of the buckets shown below. This chart demonstrates the number of similar cars against their advertised price:
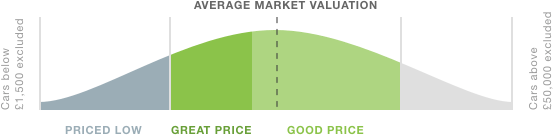
Read more about Price Indicator…
An exciting day for Charlie… this time with Price Indicator flags
Following on from our previous example, the image below demonstrates an example of what Charlie could see with the introduction of PI. The first car has been awarded the “great price” PI flag, meaning that the listed car is priced slightly below the average market. The almost identical second car has fallen into the “priced low” bucket and therefore received the respective flag.
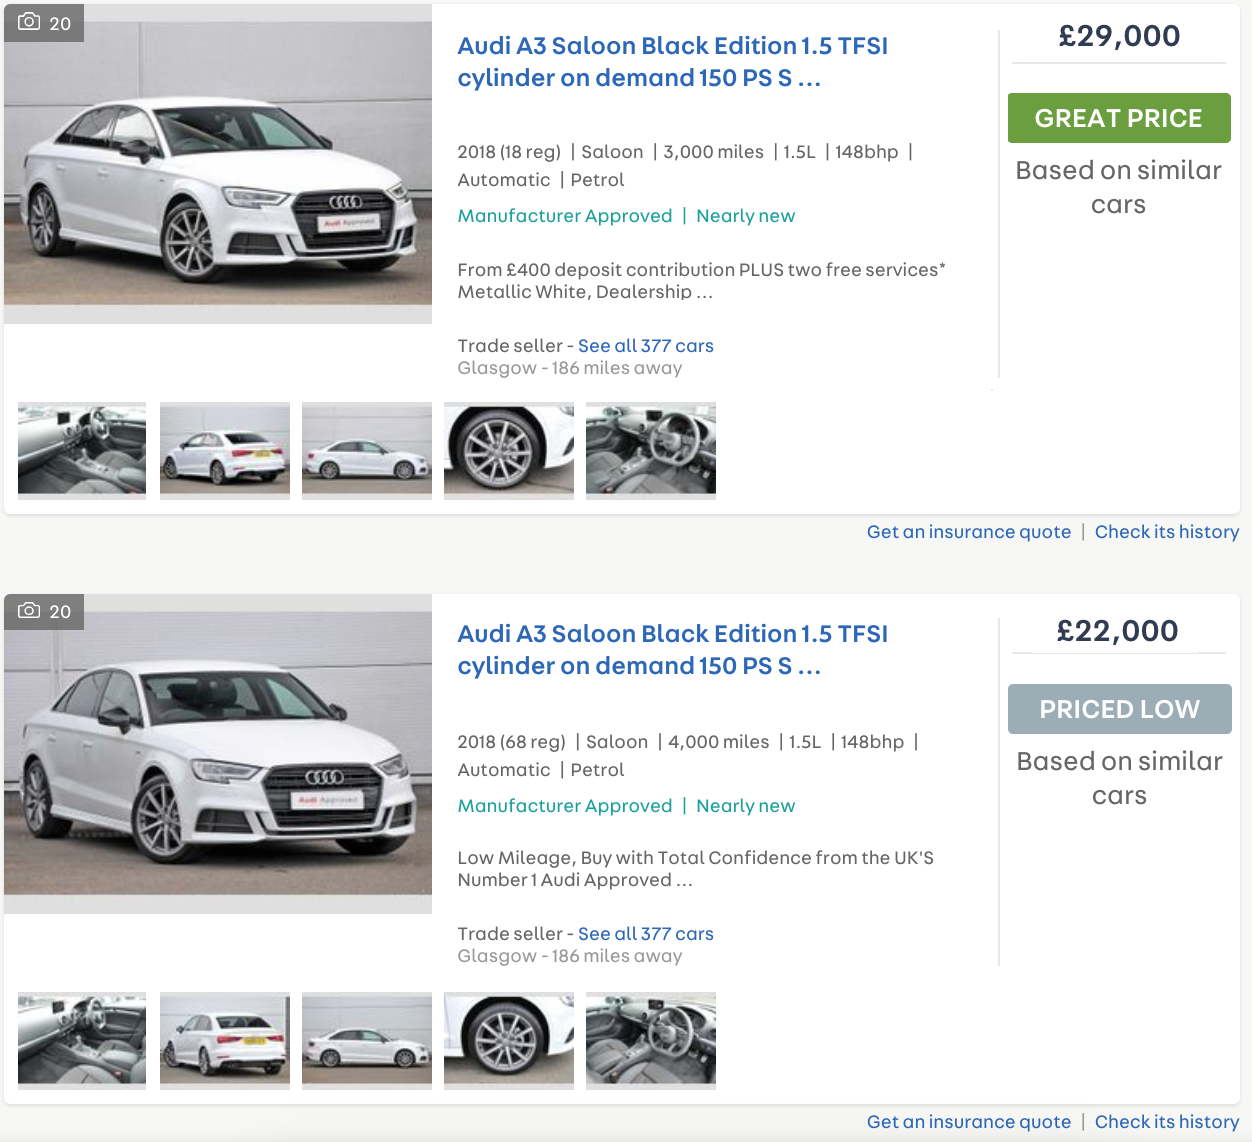
Again, these adverts aren’t real and are just indicative of Price Indicator functionality
We believe that PI has helped both buyers and sellers in many different ways.
Not only do we provide Charlie a vast collection of car listings to pick from but also a more transparent view of the automotive market place.
Due to how PI works, in order for a listing to get a flag, the seller will have to regularly check its price and make sure it’s aligned with the current market. It’s also important to make sure that each advert has an up-to-date specification and optional extras; this will have a direct impact on whether a flag is awarded. Charlie is now looking at high quality adverts, with validation that the price is actually fair for both sellers and buyers.
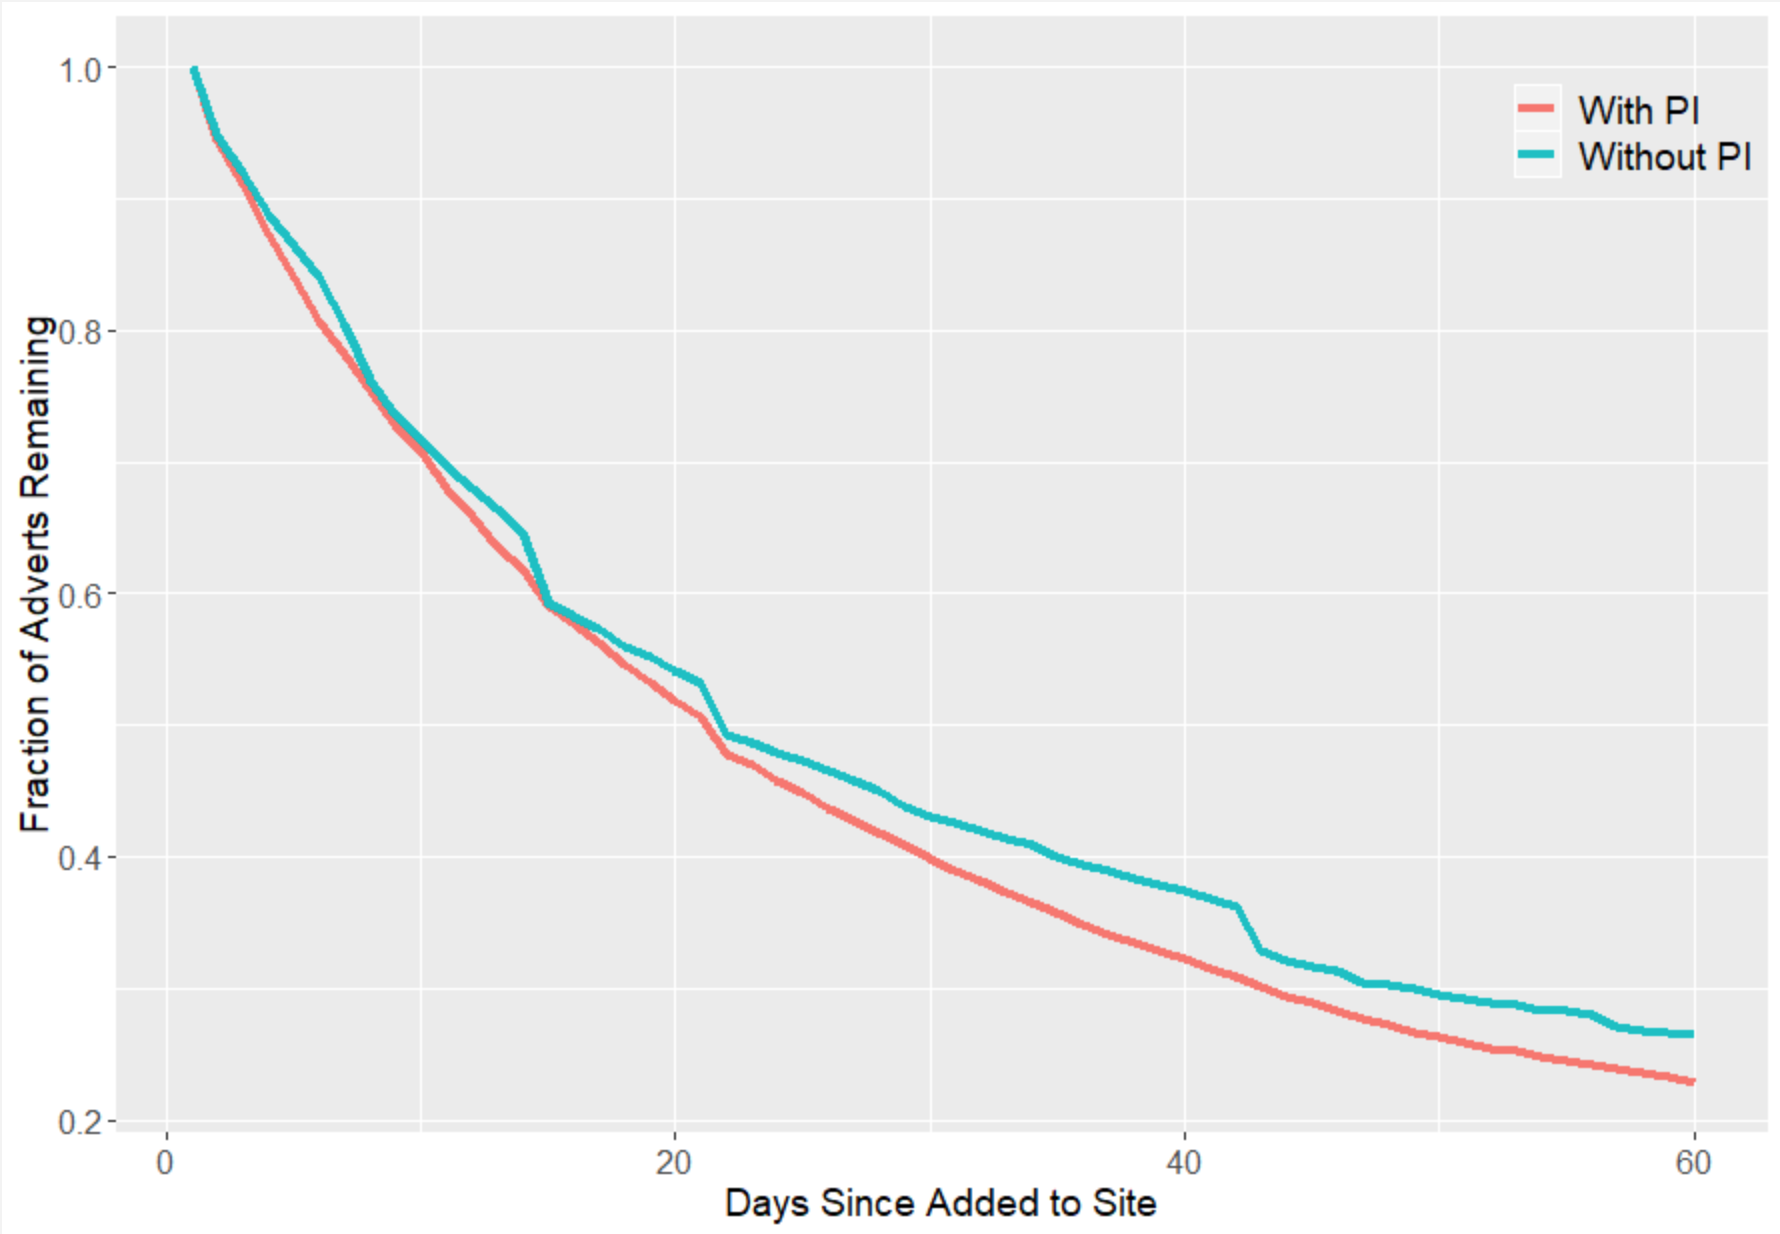
Sellers also benefit from PI as they are awarded with more advert views, giving them the chance to sell the car more quickly. The graph below demonstrates the average lifespan of an advert with PI vs an advert without one:
Read more about how sellers can benefit from Price Indicator…
Auto Trader has enabled buyers to quickly identify outstanding car listings, making such listings more attractive. If you would like to learn more about advert attractiveness make sure you watch this talk. In the talk, Jenny describes how we have utilised our Data Platform to model click-through rates on the Auto Trader UK website to estimate the ‘attractiveness’ of adverts to our users. The box-and-whisker plot below shows the difference in click-through-rate between adverts with or without a Price Indicator flag:
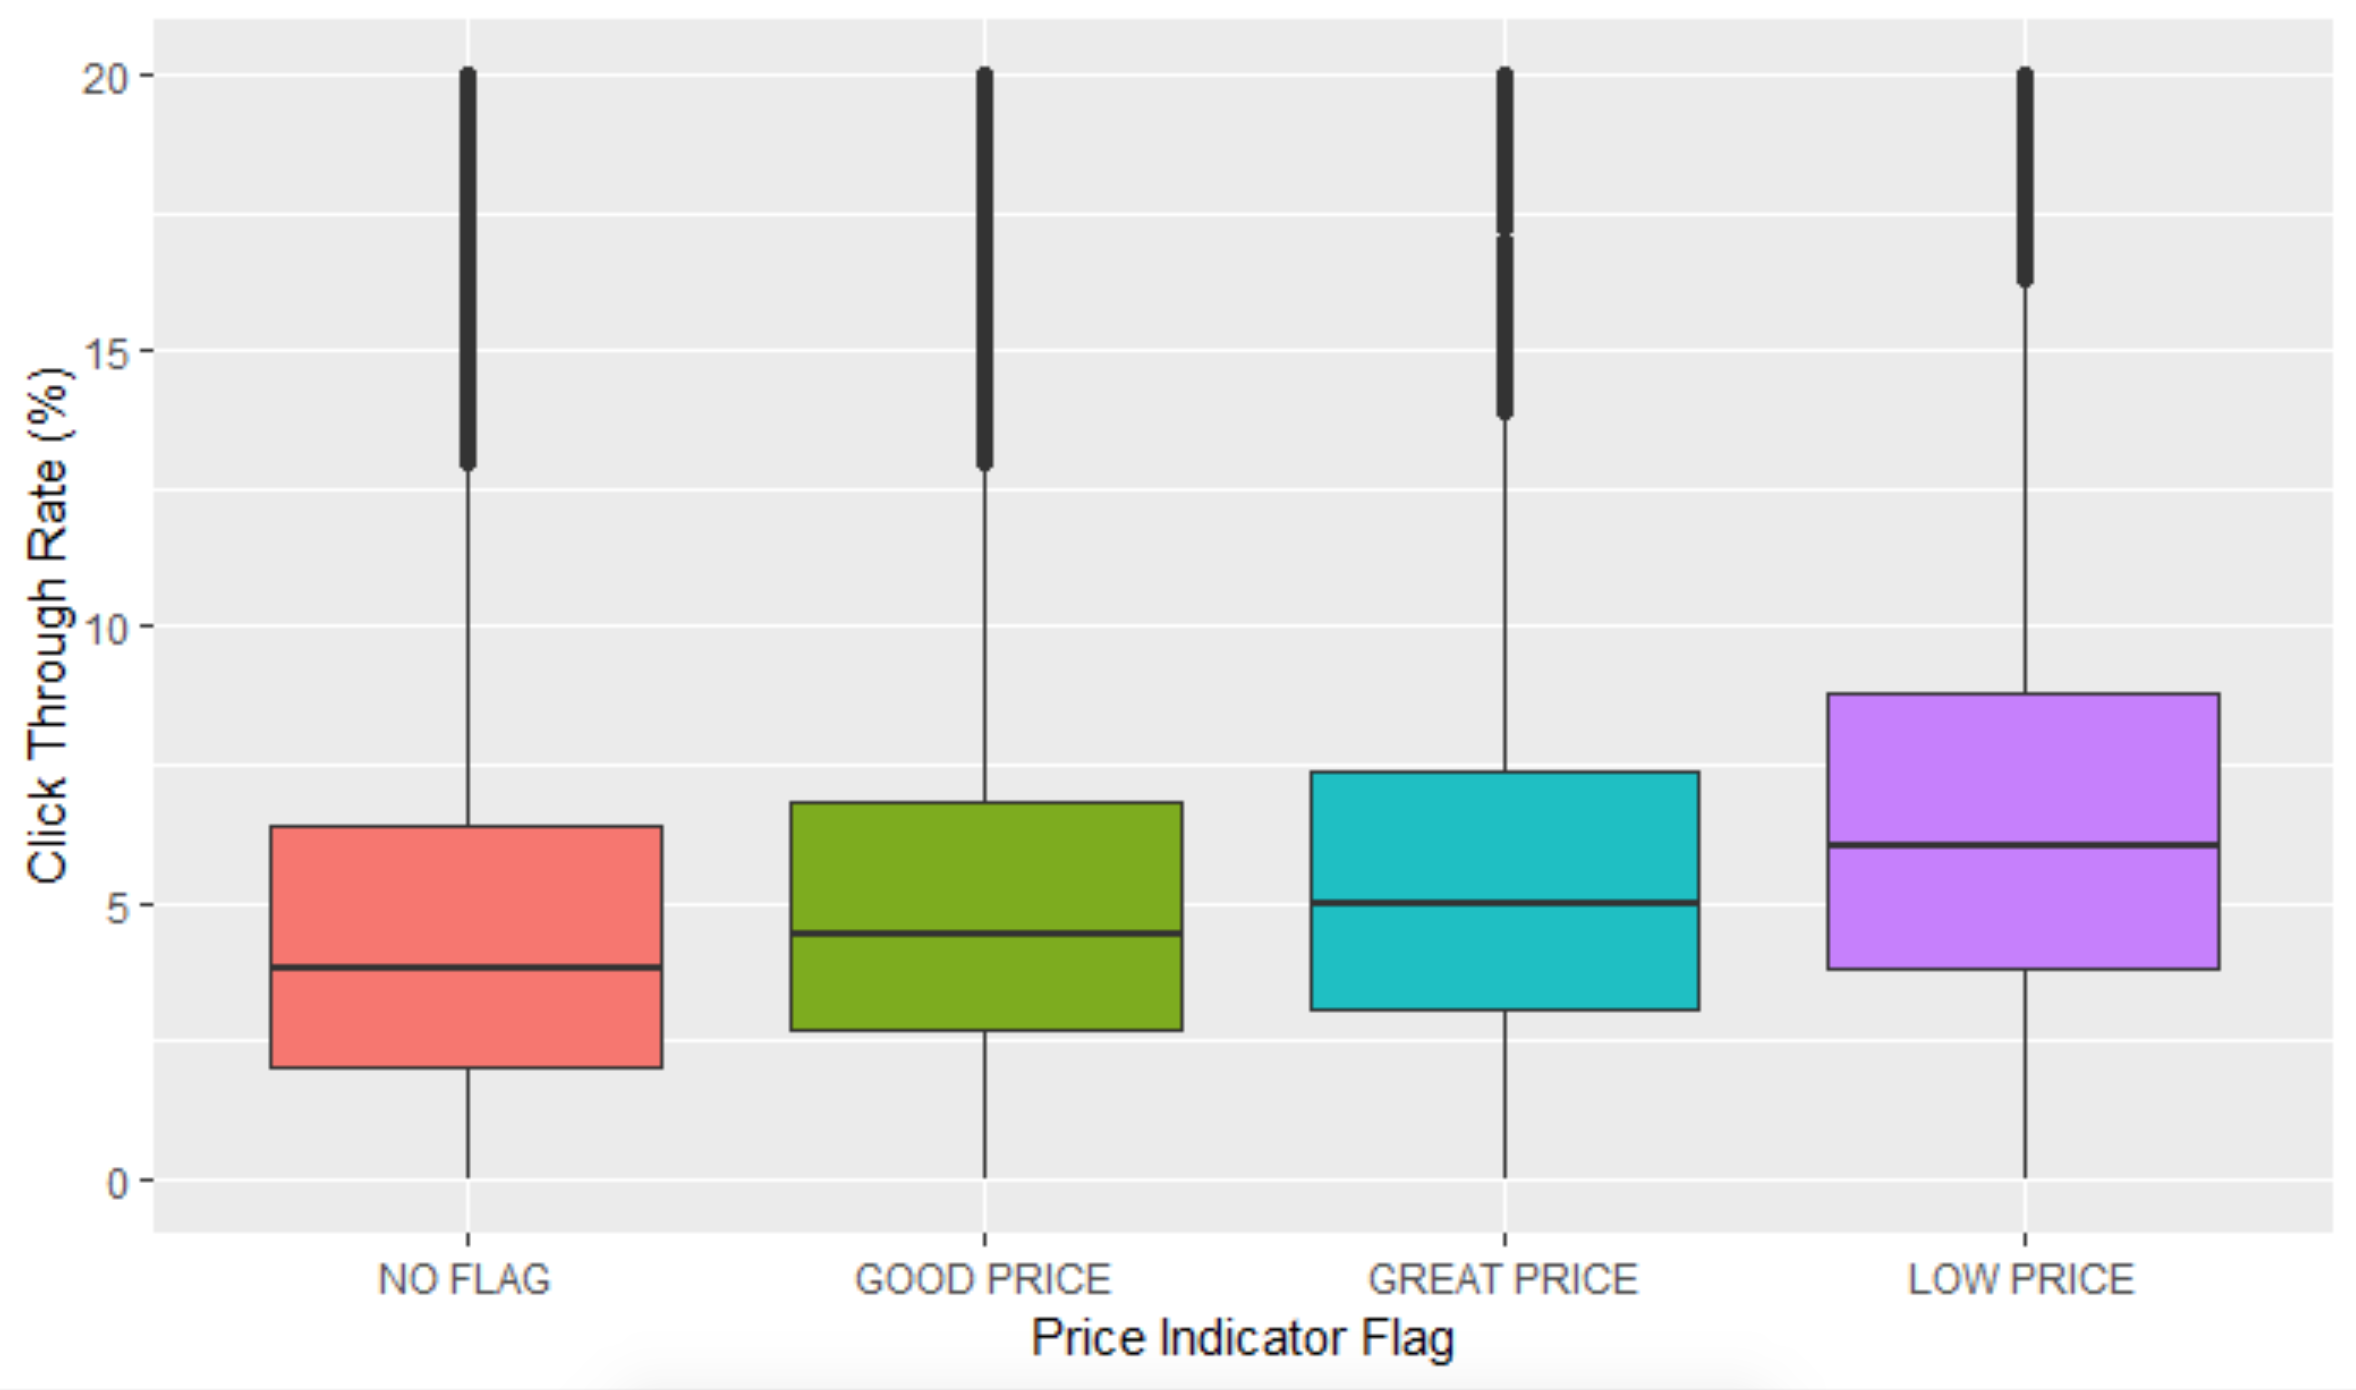
The horizontal dark line in the middle of each box shows the median (or “middle”) value of the distribution, the lower and upper bounds of the box show the 25th and 75th percentiles of the distribution. The whiskers (the vertical dark lines) are calculated as 1.5 times the inter-quartile range (the 75th percentile minus the 25th percentile). The black dots represent “outliers”.
Summary
Auto Trader was able to use Artificial Intelligence and Machine Learning to provide a transparent view of the automotive marketplace. This benefits greatly our buyers and sellers and, by extension, Auto Trader itself.
Enjoyed that? Read some other posts.
Related Posts
05 Apr 2024—Bethanie Garfin
Photo by Kenrick Baksh on Unsplash
At Auto Trader, the behavioural events we collect about our consumers are a core part of our data platform, fueling real-time personalisation on-site and reporting our core business KPIs. Because...
05 Oct 2023—Tim Summerton-Brier, Stevie Woods, John Harrison
Photo by Tico Mendoza
Back in April, Auto Trader gave a few of us the opportunity to attend Data Council 2023 in Austin, Texas, USA. Data Council is an independently curated conference that covers many aspects of working...
17 Apr 2023—Olivia Pennington & Tom Armitage
Photo by Nik Shuliahin on Unsplash.
You’ve done the hard work in researching, developing and finally deploying your shiny new Machine Learning (ML) model, but the work is not over yet. In fact it has only just...
24 Mar 2023—Tom Armitage & Olivia Pennington
Photo by Stephen Dawson on Unsplash.
Advertising packages are the core product at Auto Trader. Depending on the package tier our customers purchase, they get to appear in...
