Data Universe event videos
It’s been a few weeks now since our last public tech talks event—a big thank you to all who came. Thanks also for all the feedback we received on the evening. We plan to use this to help shape our next event. For anyone who missed the event, please find the videos of all the talks below. Watch this space for details of our next event in the new year.
The videos
Lessons from the Lake—Joe Mulvey
The Auto Trader Data Platform is at the core of our ‘self-serve’ philosophy of empowering business teams to make data-driven decisions. Building it has required us to make choices about architecture, design and technology. How did we do? We take a look back at three critical decisions.
Selecting ‘attractive’ adverts by modelling click-through rates at scale—Jenny Burrow
In this talk, Jenny describes how we have utilised our Data Platform to model click-through rates on the Auto Trader UK website to estimate the ‘attractiveness’ of adverts to our users, and to select which adverts to display.
Scheduling ETL jobs as code using Airflow—Sam Wedge
We have many ETL jobs pulling data into our Data Lake from various databases, APIs and Kafka topics. We then process that data to ensure a consistent schema, filetype, structure and to remove sensitive information. On top of this, we have refining processes to prepare the data for specific use cases: joining datasets, calculating new fields, removing old fields, deduplicating rows, generating aggregate metrics, performing integrity checks etc. Each of these processes has different requirements to run, which could be dependent on the time of day, the existence of previous data or the successful completion of a previous task. This talk shows how we manage these tasks with a testable and reliable scheduling system with alerting, all configured through code.
“Your call is important to us… please hold while we analyse this”—Tom Collingburn
Tom demonstrates how Python & Databricks can enable anyone (even a Python beginner like himself) to identify meaningful topics in unstructured data and visualise the results so that non-data consumers can use the analysis to support business decisions.
Enjoyed that? Read some other posts.
Related Posts
15 Aug 2024—Tom Armitage & Dustin Hayden
Image source: Wikimedia Commons.
The Bayesian approach to A/B testing has many advantages over a Frequentist approach. However, there are some drawbacks. This post discusses these challenges and our attempts to overcome them.
14 Aug 2024—Tom Armitage & Dustin Hayden
Image source: Wikimedia Commons.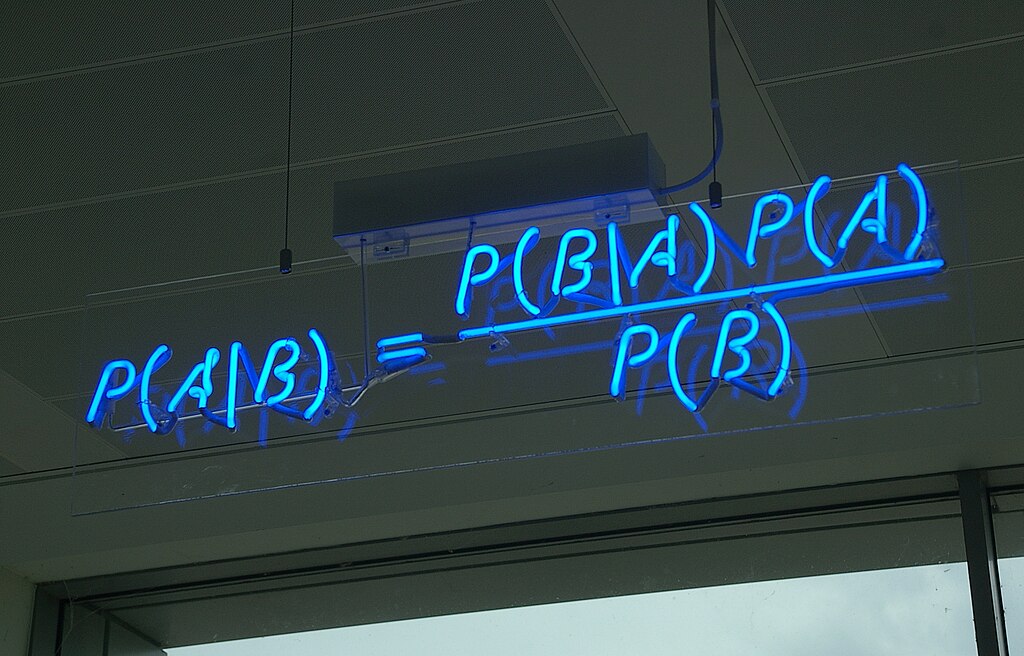
Websites are constantly changing. Here at Auto Trader, we use A/B testing to monitor the impact these changes have on the user’s experience. Fundamentally, we need to gather sufficient evidence to make a decision...
04 Jul 2024—Mahmoud Oshagh
Photo by Eugenio Mazzone on Unsplash.
Have you ever stumbled upon something that just completely captivated your attention? That was precisely what happened to me when I first came across Large Language Models (LLMs). It was during...
19 Jun 2024—Stevie Woods and Philippa Main

Data underpins and helps to drive every part of Auto Trader’s business. With over half a million listed vehicles and 1.4 million visitors to Auto...
31 May 2024—Tom Armitage & Tom Kelly
Image source: Wikimedia Commons.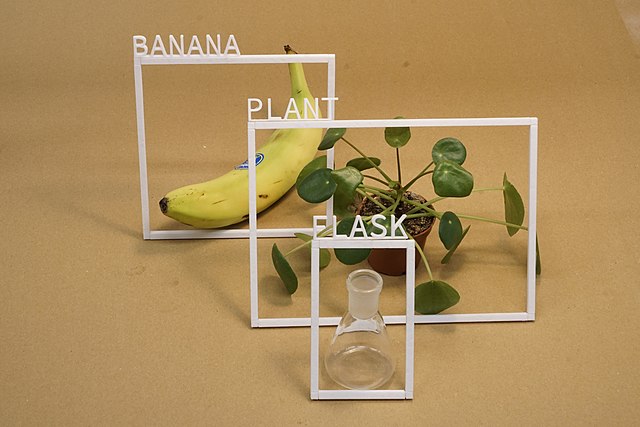
There has been great advancement in recent years in the field of image classification. With pre-trained models readily available and mature libraries making the process of developing and training your own models easy, you...
05 Apr 2024—Bethanie Garfin
Photo by Kenrick Baksh on Unsplash
At Auto Trader, the behavioural events we collect about our consumers are a core part of our data platform, fueling real-time personalisation on-site and reporting our core business KPIs. Because...
05 Oct 2023—Tim Summerton-Brier, Stevie Woods, John Harrison
Photo by Tico Mendoza
Back in April, Auto Trader gave a few of us the opportunity to attend Data Council 2023 in Austin, Texas, USA. Data Council is an independently curated conference that covers many aspects of working...
17 Apr 2023—Olivia Pennington & Tom Armitage
Photo by Nik Shuliahin on Unsplash.
You’ve done the hard work in researching, developing and finally deploying your shiny new Machine Learning (ML) model, but the work is not over yet. In fact it has only just...
24 Mar 2023—Tom Armitage & Olivia Pennington
Photo by Stephen Dawson on Unsplash.
Advertising packages are the core product at Auto Trader. Depending on the package tier our customers purchase, they get to appear in...
