It matters what you measure
It’s not enough to simply measure things, you need to measure the right things! When I first introduced release reporting at Auto Trader I based the success criteria on the things the business cared about at the time. It was very basic and a release was deemed to have ‘failed’ if it was either backed out or needed to be fixed. As the way we measured success evolved we noticed how this didn’t really represent the direction we wanted to follow.
Our original success/failure categories soon became nine categories of ‘success’ and ‘failure’, with categories 1–3 were considered successful and 4–9 to have failed.
- Total Success
- Part Success—Delay due to Live Issues
- Part Success—Planning Delay
- Part Failure—Live Impact during Release
- Failure—Forward Fixed with no Impact to Live
- Failure—Backed Out with no Impact to Live
- Failure—Forward Fixed due to Impact to Live
- Failure—Backed Out due to Impact to Live
- Failure—Forward Fixed, then Backed Out due to Impact to Live
The criteria were based on the cost to the company, or rather the additional cost to the company above and beyond the development, test & deployment time that is accepted as part of developing and releasing software.
I was never particularly happy with them. Partly because it gets a little ridiculous when you start talking about ‘partial successes’ and ‘partial failures’, but mostly because it was needlessly complicated. What I didn’t realise at the time was that it was also encouraging the wrong kind of thinking!
Change of culture
In 2013 there was a change in the company’s leadership that caused a seismic shift in the office culture and led us to refocus our approach, putting our customers at the heart of everything we do. This gave me the excuse I needed to change and simplify our release success criteria. What I came up with was a simple RAG-based system:
- Green—Everything went well
- Amber—We had to take some remedial action, such as adding a DB index or backing out the release, but we had no customer impact
- Red—Customers, either internal or external, were negatively impacted by the release
Green and Amber releases are considered successes—only a Red is a failure. This was quite controversial at the time, as I was effectively saying that it was now okay to release a broken build into production, so long as no customers were negatively affected by it.
We can make this distinction because we release to a passive data-centre first, test on an internal address, then divert traffic to the new build & release to the other data-centre.
This gives us one last chance to catch a broken build before customers see it. Which is quite handy, as even with the best will in the world, a non-production environment will never be quite the same as production. For one thing, non-production isn’t taking live traffic, so is less loaded.
But what effect did this have?
After making this change I went back and retrofitted the new success metric for the older data, so we would be able to perform year-on-year comparisons. What I found surprised me.
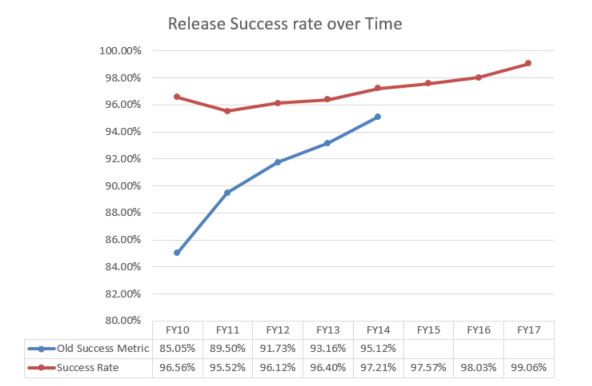
As this graph shows, we’ve always seen steady improvement in our success rate. This has been relatively easy to achieve because AT staff are a dedicated bunch and are always looking to improve things. Ultimately this is why we track KPIs—they show us where we need to do better.
As you would expect, the new success metric gave a higher result than the old one, because a lot of what we’d previously considered failures were now successes. However, while the old success metric showed a massive improvement over time, the new metric shows a drop, which took three years to recover from!
This is because we were focussing on the wrong thing.
In the old system, we were punishing development teams for any release that needed to be backed out or forward fixed, instead of encouraging them to catch issues before customers saw them.
While my intention was only to simplify our release reporting and align it with the new direction the company was taking, what I effectively did was lay the groundwork for a reduction in the number of release-related Incidents. This is the primary function of Release Management, so as unintended consequences go, it’s not bad!
Where do we go from here?
The RAG system is likely to be in place for the foreseeable future. In addition to release success, I also now use it to measure change success. It’s simple, easy to understand and puts the customer experience first, so it’s not likely to change.
That’s not to say that we’re static. As we move forward with our private cloud platform, our release techniques are changing to take full advantage of the new technologies we’re putting in place. Most of our teams are now practising Continuous Delivery and some are even using Continuous Deployment.
With the fundamentals of the release process changing, the way we measure success needs to change as well.
My current thinking is that RAG is likely to become one metric among many. I’m considering things like:
- How many red releases have we had, total?
I’m already measuring this, although not reporting on it. What’s interesting is that while the total volume of releases goes up every year, the number of failures has been steadily declining. So while the graph above that shows a steadily improving success rate is accurate, we’re not simply making ourselves look good by hiding behind skewed percentages. Last year we had 41 failed releases, out of 4366. The year before was 49 and the year before that 54. - MTTR - Mean Time To Recover
This will be driven by the incident process. What is interesting here is how quickly we are able to respond to and resolve release-related Incidents. This naturally follows from basing our success/failure criteria on customer impact. If we negatively affect our customers’ experience, I want us to resolve that as quickly as we possibly can. - Average length of time between releases for an app
This is interesting because the shorter that gap is, the simpler the release is likely to be. The simpler a release is, the easier it is to test and the safer it is to deploy. - Average length of time between commit and production release
This shows how quickly we can fix an incident, once that fix has been identified.
All of these have the potential to drive improvement, so I’ll want to measure all of them and probably other things too. Before reporting on the data though, the first question I’ll ask myself is:
What behaviours am I trying to encourage?
Be careful what you wish for…
The lesson I’ve learned from this experience is that if you measure the right things, you will encourage the right behaviours. Had we been using the RAG system from day one, I’m confident we would have achieved 99% success a few years earlier.
KPIs are often used as either a way of making a team/department/company look good or a stick to keep staff in line. This is faulty thinking and potentially quite damaging in the long run.
A KPI only adds value if it is in line with the company values and helps drive improvement in the customer experience.
Enjoyed that? Read some other posts.
