Experimentation at Auto Trader
Experimentation—or ‘AB testing’—is a vital part of adapting to the ever-shifting behaviour of users on the internet. In this brief (albeit hopefully informative!) blog post, I will be covering how we’ve historically approached this topic at Auto Trader. I’ll then go on to describe the changes we’re putting in place to make it an even more effective tool in our kit as we move into the landscape of digital retailing. Finally, I’ll go through how we envisage the process to look in the future.
So, what exactly is experimentation?
Well, simply put, it is when a change is made on our website that is tested on a small proportion of users before being pushed live. The term ‘AB testing’ is probably a more apt descriptor of the concept: suppose we have two subsets of users, A and B, where one subset is introduced to a change and the other isn’t. We can then look at the two groups in parallel and deem whether the change had a significant effect on behaviour or not.
This process is important as it gives us insight not only into how it will directly influence user behaviour, but also highlight any knock-on effects the change might have on our other products and functions. For example, suppose we give prominence to electric vehicles (ie. we rank them higher in the search parameters somehow). This might feed back amazing results for the number of advert views on electric cars, but what about petrol and diesel? These vehicles account for the majority of stock that smaller, second-hand retailers hold. Given this, it may have an adverse effect on the number of sales they generate on our website. Hence the amount of value they receive from their subscriptions with Auto Trader will also be impacted. AB testing can give us an idea of the bigger picture whilst mitigating risk. The correct implementation of experimentation is thus pivotal to its success.
Great, but how do we do things at Auto Trader?
We’ve been running tests on Auto Trader for a good while now. And while this is great due to the amount of data we have on previous experiments, it also means enough time has passed for the practice of AB testing to have propagated through teams across the business. These teams then implement their own experiments-of-sorts, unwittingly creating a disparate system of testing. At the start of 2021, a few of us analysts sat down and decided to draw up a unified approach that would ensure these tests were consistent across the board.
In order to understand the guidelines we constructed, I think it’s important to first understand a few of the anti-patterns that motivated this conversation. Below are the most common ones, though keep in mind these are not exhaustive:
-
Lack of analyst involvement – without an analyst involved in the process from the get-go, what we’ve historically found is that the hypotheses constructed before running tests haven’t been robust enough. A strong hypothesis, as well as analysts who are aware of the common pitfalls of experimentation, are essential to a successful test.
-
‘Peeking’ at the results – we often see an initial period of instability in our metrics once we make a change; this is something that settles down as the test approaches the end of its run-time. If teams take what these metrics are saying as the be-all-and-end-all during this period of volatility (and before the analyst involved gives them the green light to check the numbers), then incorrect conclusions can easily be drawn prior to the results settling.
-
Overlapping tests – it is a given that multiple tests will be running at any one time on our website, however it is prudent these tests don’t overlap where possible. Overlapping users across test buckets can inevitably affect our results, making them more nuanced and difficult to interpret.
As well as the above, it is also key to understand the structure of a test. There are typically three stages: planning, running, and analysis. Counterintuitively, the smaller a change you’d like to detect, the longer the test needs to run to reach power, and this is shown through an exponential decay curve.
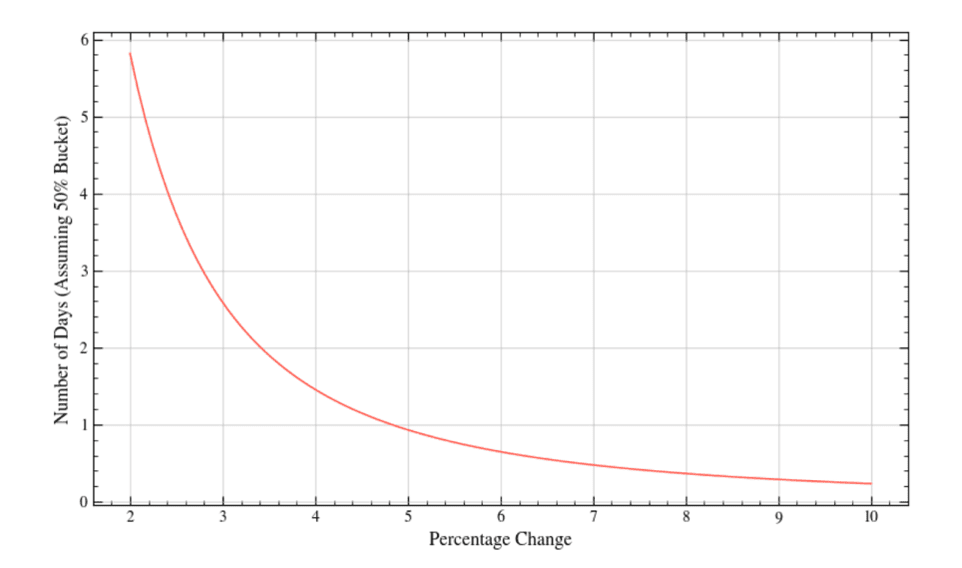
The test should run for at least the calculated run-time so it can reach power. This is a useful safety measure that can tell us whether we’ve got enough data to confidently say the change was due to a genuine shift in behaviour (and not purely down to chance). When we’re confident power has been reached, post-test analysis can then begin.
Our new approach to AB testing is a take on tackling the issues outlined above and more. We’ve put together a few guidelines, created a presentation to run teams through, and full documentation has been uploaded to our in-house Data Handbook. By doing this, we hope to get everyone on the same page via analysts who know these guidelines inside out. Our Jira board ensures we’re aware of all the experiments that are in play. And through regular meet-ups we discuss any discrepancies or stumbling blocks that crop up.
Previously what we were seeing when it came down to the analysis itself were analysts running calculations locally, commonly through R and RStudio. These are powerful tools for visualization, although the results are difficult to share. This goes against our ethos of taking a consistent approach so we can compare test results with a certain degree of parity.
Instead, each analyst involved in an experiment now uses the same set of Databricks notebooks, using Python for our calculations. These notebooks are cloned and adjusted accordingly—source control similar to the way we work with applications is currently under discussion. Doing this also makes knowledge sharing much more collaborative, and it is easier to assist one another if difficulties are encountered in the analysis.
Looking forward
To finish, our outlook for the future is a positive one. A few experiments have now been run with this revamped process in mind; from what we’ve seen so far, teams are keen to adopt the guidelines we’ve put together. We’re also in a stronger position to test conversion metrics further along the journeys users take on our site, which will be an invaluable tool as we move into digital retailing. The conversations surrounding experiments are on the whole clearer and more streamlined. More informed and robust hypotheses are coming to fruition. And over the coming months, we are hopeful we can roll this out to even more teams and make our AB testing strategy a simpler one, with results we can have faith in.
Enjoyed that? Read some other posts.
Related Posts
23 Nov 2022—Connor Charles, Andrew Crosby, Jason Motee, Michael Reppion, Olivia Pennington
Photo by Markus Quinten de Graaf on Unsplash
Here at Auto Trader, we aim to help customers find their perfect vehicle as quickly and easily as possible. But with over 400k vehicles advertised onsite at any one...
