To App or Not to App (Rapid Data App Prototyping in the ML Experimentation Cycle)
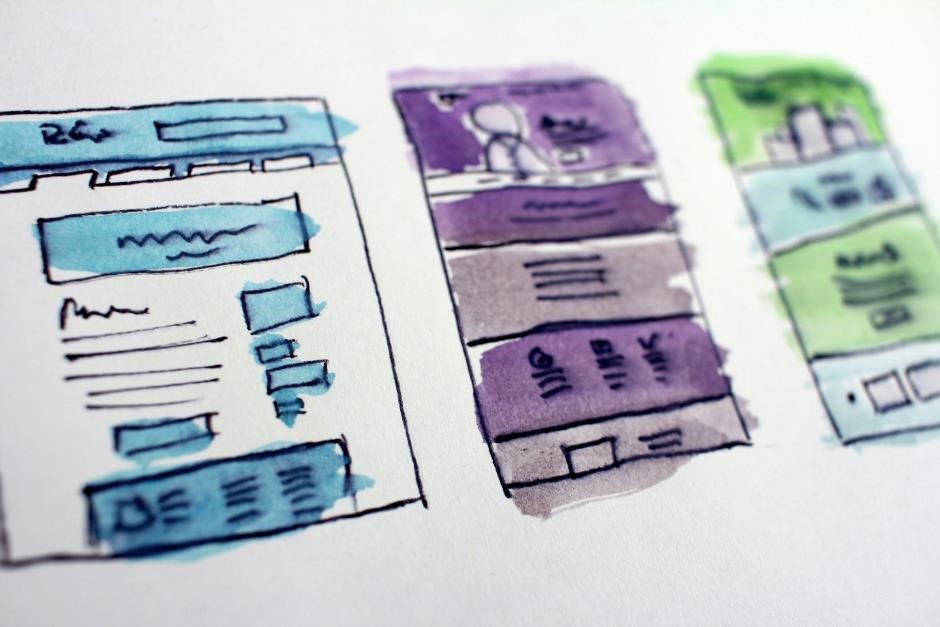
Photo by Hal Gatewood on Unsplash.
The experimentation stage of Machine Learning (ML) development for a data analyst/scientist can be a solitary experience. Often, you will be one of the few data professionals in the team or the business, and getting feedback on your work in its raw experimental form can be challenging. Additionally, you may have to explain core data concepts or present results in an undesirable format, such as a Python notebook, which can provide additional barriers to sharing your progress. In this post we’ll discuss how data app prototyping can be used to overcome some of these barriers, as well as some of the pitfalls they may present.
In my previous role as a data analyst in the Platform Tribe at Auto Trader, my primary responsibility was to assess our valuation models for improvement and report back to our data scientists and developers to implement changes. This involved setting up experiments, tweaking some of our valuation models, and presenting the analysis of the results to the team’s stakeholders. Fortunately, the environment in this role was different from my previous experiences, with nearly all stakeholders from a technical data/coding background, including our extensive analytics team. This allowed input at all stages of work, including the experimentation stages.
In my current position in the API team however, my focus has shifted to customer integration setups and usage to report back to our product owners, delivery leads, and customer operation teams. This presents a very different set of less technical stakeholders for presenting ML data models to. Scrolling past blocks of code in a notebook or subjecting people to death by PowerPoint is an option but could quickly disengage the audience from what is being presented. To solve this, I decided to use a useful tool from my previous job - prototype data apps.
Before I joined Auto Trader, I worked for the Greater Manchester AI Foundry. Our main task was to help businesses start their AI journeys by kickstarting their development and providing them with the resources to attract further funding for the project. Many of these businesses had great ideas but no personnel with coding skills. For reporting, we used a rapid prototyping development cycle where a data app was created to showcase the progress from each development sprint. This method helped us to focus on what tangible improvements had been made during each sprint and really cut through the noise for our non-coding stakeholders.
Why Data Apps?
We have all experienced a situation where someone is trying to explain something to us and we can’t quite seem to understand them. However, when they draw a diagram on the wall, everything suddenly clicks into place. This is particularly true in the world of data, where concepts can be difficult to explain using raw numbers. But when you create a good data visualization, everything becomes clear. In the world of ML experimentation, data apps can serve the same purpose as good data visualizations.
Experimentation in developing ML models can be a complex process. It involves various stages of data cleaning, optimization of model variables, and multiple iterations of work. However, when someone asks about the progress made in the project, it’s not an effective way to present the data by scrolling up and down a notebook. This is especially true for those who are not familiar with the data you are working with or don’t have any experience with data or code at all. In such cases, a data app can be a great way to cut through all the noise and present the data in an easily understandable way. Developing a rapid prototype also helps to clarify the thought process of the person developing the ML model and highlight only the essential features that need to be communicated to a wider audience for review.

Lines of code can provide an unwanted barrier for non-technical stakeholders during ML model experimentation. Photo by Joan Gamell on Unsplash.
Example Use
We are currently working on a project to develop a machine-learning model that can detect any unusual usage of our APIs. Our goal is to use this information to quickly identify any issues before they can cause any disruptions to our services. The model is designed to monitor the traffic on each of our APIs across all partner apps and assess whether the traffic for the most recent day is consistent with the historic usage patterns. The project requires close collaboration with our customer operations team, who are responsible for managing our technical relationships with our integration partners and troubleshooting any issues with our APIs.
Early on in the project we decided to wrap our experimental model in a data app using the Streamlit Python library. This low-code rapid prototype proved a great tool for explaining the model across teams, highlighting the important features to all involved of the model hyperparameters, and how adjustments to them affected the anomalies detected and was used to pitch the concept to high-level stakeholders before getting the green light for further development. It has also proved very useful in the development cycle of the project where a feedback loop has been established with the customer operations team to highlight false positives generated by the ML model. The app provides a focal point during meetings where current errors in the background logic can be identified and adjusted for the next cycle of testing.
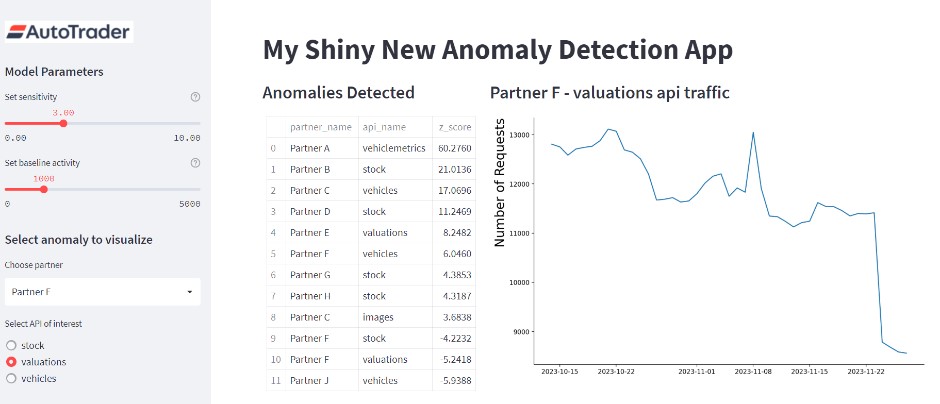
Example of the prototype data app created for our API anomaly detection work.
The Arguments Against
Data apps are a great way to visualize data and produce professional-looking apps with little effort. However, you should exercise caution when using them, as these apps may give a false sense of progress and raise expectations among stakeholders, leading them to think that the app you created is a finished product that they can go live with. This temptation seems to get stronger the further a stakeholder is from the project having limited knowledge of the experimentation work. But by modifying these throwaway apps into a minimum viable product, some steps in the dev ops cycle will inevitably be skipped, setting yourself up for a fall further down the line when any issues arise.
Even if the created app is only intended for internal audiences, caving in and using your prototype as a final product can still lead to significant issues. Experienced colleagues have shared horror stories of the past where reporting was done through a multitude of different data apps, providing serious maintenance and troubleshooting challenges. This scenario is the exact reason why businesses have BI tools (such as Looker, Tableau or Power BI) to homogenize the way insights from data are modelled and reported, preventing a slide back into previous less ideal reporting landscapes.
Summary
In conclusion, rapid prototyping of data applications can add significant value to the machine learning experimentation cycle. It provides an easily accessible visualization for all project stakeholders, democratizing the process by allowing non-technical stakeholders to contribute at an early stage. However, it’s important to remember that these applications are designed to be disposable and no to get too attached. It’s never worth investing too much time trying to turn them into full-blown reporting tools or minimum-viable products, productionization is best left to the professionals in engineering and development.
Enjoyed that? Read some other posts.
Related Posts
25 Oct 2024—David Davies

In Part 1, I introduced JGit and its basic concepts for working with Git in Java. We covered how to clone a repository, make some changes to it, stage those changes,...
23 Oct 2024—David Davies

Have you ever wanted to work with Git in Java? Did you know there’s a library for that? It’s called JGit!
I recently had to work with a Git repository that is hosted...
14 Aug 2024—Tom Armitage & Dustin Hayden
Image source: Wikimedia Commons.
Websites are constantly changing. Here at Auto Trader, we use A/B testing to monitor the impact these changes have on the user’s experience. Fundamentally, we need to gather sufficient evidence to make a decision...
19 Jun 2024—Stevie Woods and Philippa Main

Data underpins and helps to drive every part of Auto Trader’s business. With over half a million listed vehicles and 1.4 million visitors to Auto...
07 Mar 2024—Marcus Wong

After 1.5 years in the Early Careers Academy at Auto Trader, I thought it would be great to share my experience so far as a graduate data analyst and what I’ve been up to here.
Back in 2022, I graduated from the University...
