Recommendation Engine Hack
Creating a Recommendations Engine
Anyone shopping online these days will usually find a section of the page dedicated to recommendations. It usually states something like “customers who viewed this product also viewed…”. It’s known by many as the Wikipedia phenomenon, where looking up one article you are linked to another, and then another, until you are found hours later, still on the same site, older but so much more well informed.
When I was looking for my first car on Auto Trader, I had an idea that I would know what I wanted when I saw it, and it took many searches of lots of different makes and models to understand what I wanted. What I needed was a little inspiration; a little nudge in the direction of similar cars that may not have fit my original search criteria, but which were clear contenders given the cars I had already selected. What I needed was a recommendation engine.
A benefit of being a market leader is that we have the best chance of being able to use the insight of customers for the benefit of others. We get more advert views than any other vehicle website, and advertise more vehicles than any other. This was clearly a contender for the hackathon.
So, where do we go to find out what users like?
To understand what adverts would be interesting to users who had viewed a particular advert, we needed advert view data for all our users, specifically data that maps a user to all of the adverts they viewed.
Fortunately, our security team have created a database just for this purpose, the httpshark database, in order for them to identify bots who are crawling the website, or attempting to cause a DOS attack. A dump of this data to a spreadsheet gives us a row for each advert view, identifiable by user (personal details are obfuscated).
So, what kind of AI do we use?
We had 2 days and a lot of data. A simple algorithm is to create a map of each user to a list of all pages they viewed from a dump of a day’s worth of data in httpshark. We then create another map of each page to a weighted list of pages that we can then recommend if a user is on that page. And creating this map A -> [B] is as simple as counting up the page views for page B given that the same user has also looked at page A.
Just counting views? Can’t we do something more intelligent?
For our purposes, we want to find the probability that a user will view page B given that they’ve viewed page A. The formula is:
So we might build a map entry A -> [B:4, C:1, D:1] where 4 users who viewed A also viewed B, 1 viewed C and 1 viewed D. This gives us the top part of the equation. Now to complete this formula we calculate P(A), which is the same for all A, B and C, so we may as well leave this part out! And luckily, the complexity of this super-simple algorithm is O(n). In fact, it took about 10 minutes to run on my Mac, using a whole day’s worth of Auto Trader’s ad views!
Well, it’s almost that simple.
One thing to note, is that we need to avoid users who sit behind proxies, or bots: basically anyone with a single ID that have a significant number of ad views - I set that number to 200 in our code. For one thing, these users don’t give useful recommendations, but for another, when we have ‘n’ as the number of ad views for a single identifiable user, the algorithm complexity is O(n^2), and will take significantly longer to run.
We also want to mitigate the risk of users gaming the system and viewing their ad many times to ensure it’s recommended, so in the map entry above we only count one ad view per user.
We also might be better off using more than one day’s worth of data, but for a first trial, one day helps ensure that newer ads aren’t overlooked by the algorithm, and fewer deleted ads are found.
So, we have our recommendation map, do we get good recommendations?
We were planning to put up to 3 recommendations on each advert, so it was worth building a graph to understand how often we’d get all three recommendations, and of what quality the recommendations are. I made the assumption that the weight given to the recommendation (as in our map entry above) would indicate the quality of the recommendation. I created 3 graphs.
The first histogram assumes we show only 1 recommendation. The x axis shows the quality of the recommendation, and the y axis shows the number of ads within Auto Trader that have this quality. I repeated the graph for 2 recommendations and 3 recommendations.
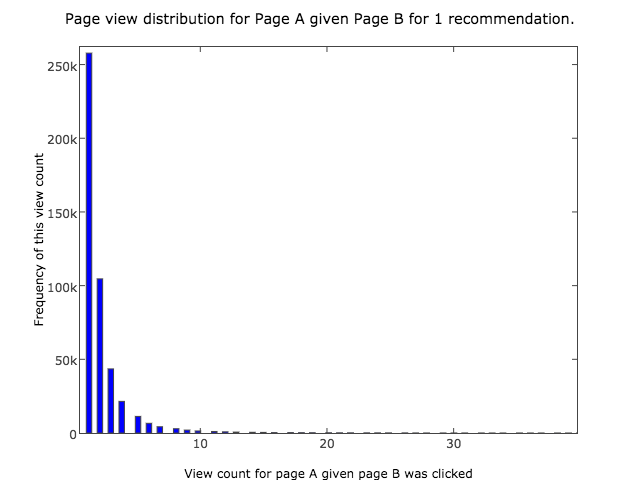
Here, the first bar on the histogram shows us that for 250,000 ads, the best recommendation had only 1 view. (We later set the recommendation engine to require a minimum number of views, so 250,000 ads would have no recommendations.). The second bar shows us that for 100,000 ads, the best recommendation had only 2 views. There is a long tail towards the right that is not shown in the image, but shows that a small number of ads have high quality recommendations based on hundreds of views.
.png)
Here we measure the quality of the second best recommendation for each of the ads.
.png)
Here we measure the quality of the third best recommendation for each of the ads.
That looks like an awful lot of ads have low quality recommendations
The histogram did show some disappointing results. Many of the ads wouldn’t carry any recommendations, and lots of recommendations would be based on just a small number of ad views.
Zooming out of the graph though, we see a long tail to the right, that shows a small number of ads with very high quality recommendations. Would we see those adverts often? We’d need to hack together a prototype to find out!
What did the prototype look like?
Using the recommendation map printed to file as JSON, the hackathon team created a REST service that took an advert page as input and output a list of recommendation pages, sorted by weight. There was also an ‘explain’ endpoint that would tell us the weights for debugging later. The service also retrieved all recommended ads from SearchOne, to ensure that they still existed before they were returned.
This was plugged into Sauron, and up to 5 thumbnail images of recommended vehicles were displayed on each advert page, linking to the recommended pages.
What did the prototype tell us?
Astounding results! When we searched for cars, using common searches, almost every ad we viewed showed 2+ recommendations, and those recommendations were useful! They tended to be in the same price bracket as the page we were viewing. They didn’t always match our search criteria, for example, the make and model might be different, but the overall car was of a similar type to the advert we were on. For example, one of the team searched for a Model T, which had very few results, but when he viewed a result, he was recommended Ferraris and other makes that he was in the habit of viewing.
So was the graph wrong?
It seems that the ads that had no recommendations tended to be at the end of the search results, in a long tail that a lot of users would never get to. The overall user experience was much better than the graph appeared to predict! It was quite easy to go from recommendation to recommendation without ever needing to hit the back button. The Wikipedia phenomenon was here!
How are recommendations different to search results?
Our search results show exactly what the user has asked for. For example, when our team member searched for Model T’s, his search results would only showed Model T’s. However, we know that users who viewed Model T’s also viewed Ferraris. Our recommendation engine can show vehicles that are similar without our ever needing to explicitly define links between Model T’s and Ferraris, and because the recommendation model is generated nightly from a single day’s result, we keep up to date with any trends.
Any problems with just browsing recommendations?
One issue we flagged early was the possibility of vehicles recommended being prohibitively far from the location that the user searched for. Luckily, the recommendations tended to be close to the original advert. However, if someone browsed from recommendation to recommendation, they would go on a random walk, drifting further and further from their original search criteria. This can be useful when it comes to car spec, but we don’t want the user to have to drive for hours to pick up a car, so the recommendation REST service was enhanced to weight vehicles close to the postcode in the search criteria higher.
So what did we learn?
Creating a recommendation engine is a great way to get to know your customer. We can answer questions like: what cars are similar; do customers search in a large or small price bracket; do they view cars outside their original search parameters. Even if we don’t go live with recommendations, we’ve already mined great value from the treasure trove of data that we have at Auto Trader.
Most importantly, don’t just look at the numbers when you’re deciding on how well your data gives predictions. Hack it together and get people looking at it! It’s surprising what questions you forget to ask yourself, that just playing around with a live application will remind you of.
Enjoyed that? Read some other posts.
