Customisable Logging on Kubernetes
Centralised logging has been a part of Auto Trader for the best part of eight years—the last three of which we’ve adopted Elasticsearch as our choice of software.
From application logs to system logs, monitoring logs to security logs; we try our best to provide a central location for users to log what they care about and we try to make it as easy as possible to do so. This is true for our current platform and we aim to make it true for our next generation platform, running Kubernetes on Google Cloud.
This post will cover the solution we’ve implemented to achieve good logging on Kubernetes.
Kubernetes
As we embark on this migration to Kubernetes, it’s even more important that we provide the same logging capabilities that we have on our current platform. Being reliant on logs written to disk simply isn’t an option anymore; pods come and go on a frequent basis, and logs for those pods are only kept for a small buffer window. It all becomes a moving target.
We initially started with a commonly suggested approach to getting Kubernetes logs into Elasticsearch; deploy a Fluentd or Filebeat DaemonSet to your Kubernetes cluster and have it slurp up all the logs and forward them to Elasticsearch. This gave us some quick initial value however the cracks quickly began to show:
- Saturation: This approach collects all container logs across your cluster. Some applications are incredibly noisy and the impact of the large ingest volume they cause often isn’t worth the benefit they provide. Logging everything is cool, but it isn’t necessary.
- Multiline & Parsing: Logs come in all shapes and size, from Nginx access logs to multiline JSON blobs. Logs often arrive in Elasticsearch malformed and parsing them into meaningful fields is difficult.
What we really wanted was to provide an opt-in Logging as a service to our end users deploying software to our Kubernetes cluster, that allows them to get meaningful log messages without having to understand the complexities of our Elastic stack.
This post is going to cover how we’ve implemented a solution to achieve this using Elastic Filebeat. We wanted to find a way to provide self-serve filtering and log-parsing functionality to our users so that the logs presented in Kibana are as useful as possible.
The Nuts & Bolts
The story begins the same. We run a Filebeat DaemonSet that mounts the underlying host’s container logs directory so that Filebeat can see and read all the container logs.
DaemonSet Configuration
apiVersion: extensions/v1beta1
kind: DaemonSet
metadata:
  name: filebeat
  namespace: kube-system
  labels:
    app: filebeat
spec:
  revisionHistoryLimit: 1
  selector:
    matchLabels:
      app: filebeat
  template:
    metadata:
      labels:
        app: filebeat
    spec:
      tolerations:
      - effect: NoSchedule
        operator: Exists
      serviceAccountName: filebeat
      terminationGracePeriodSeconds: 30
      containers:
      - name: filebeat
        image: eu.gcr.io/<registry>/filebeat
        args: [
          "-c", "/etc/filebeat.yml",
          "-e",
        ]
        env:
        - name: ELASTICSEARCH_PASSWORD
          valueFrom:
            secretKeyRef:
              name: filebeat-secret
              key: es_password
        - name: POD_NAMESPACE
          valueFrom:
            fieldRef:
              fieldPath: metadata.namespace
        securityContext:
          runAsUser: 0
        resources:
          limits:
            memory: 200Mi
          requests:
            cpu: 100m
            memory: 100Mi
        volumeMounts:
        - name: config
          mountPath: /etc/filebeat.yml
          readOnly: true
          subPath: filebeat.yml
        - name: data
          mountPath: /usr/share/filebeat/data
        - name: varlibdockercontainers
          mountPath: /var/lib/docker/containers
          readOnly: true
      volumes:
      - name: config
        configMap:
          defaultMode: 0600
          name: filebeat-config
      - name: varlibdockercontainers
        hostPath:
          path: /var/lib/docker/containers
      - name: data
        hostPath:
          path: /var/filebeat
          type: DirectoryOrCreate
  updateStrategy:
    type: RollingUpdate
A couple of important things to note about the above manifest:
    tolerations:
    - effect: NoSchedule
      operator: Exists
We want Filebeat to run on every node, regardless of any taints it has so that we guarantee we’re getting all the logs that we’re after.
        volumeMounts:
        - name: data
          mountPath: /usr/share/filebeat/data

      volumes:
      - name: data
        hostPath:
          path: /var/filebeat
          type: DirectoryOrCreate
Filebeat keeps a registry of which line in each file it has processed up to. If the registry data is not written to a persistent location (in this example a file on the underlying nodes filesystem) then you risk Filebeat processing duplicate messages if any of the pods are restarted.
Filebeat Configuration
In the above DaemonSet, we mounted a ConfigMap into the pod under /etc/filebeat.yml. This ConfigMap is going to contain the config that allows us to easily provide opt-in logging, as well as some nifty additional Filebeat features:
apiVersion: v1
kind: ConfigMap
metadata:
  name: filebeat-config
  namespace: kube-system
  labels:
    app: filebeat
data:
  filebeat.yml: |-
    logging.level: error

    filebeat.config:
      prospectors:
        # Mounted `filebeat-prospectors` configmap:
        path: ${path.config}/prospectors.d/*.yml
        # Reload prospectors configs as they change:
        reload.enabled: false
      modules:
        path: ${path.config}/modules.d/*.yml
        # Reload module configs as they change:
        reload.enabled: false
    filebeat.autodiscover:
      providers:
        - type: kubernetes
          hints.enabled: true
          include_annotations: ['autotrader/logging']
    processors:
    - add_cloud_metadata: ~
    - drop_event:
        when:
          not:
            equals:
              kubernetes.annotations.autotrader/logging: 'true'
    output.elasticsearch:
      hosts:
      protocol: 'https'
      username: '<USER>'
      password: "${ELASTICSEARCH_PASSWORD}"
      index: "beats-%{+yyyy.MM.dd}"
Let’s do a quick break down of the bits that matter here:
    filebeat.autodiscover:
      providers:
        - type: kubernetes
          hints.enabled: true
          include_annotations: ['autotrader/logging']
The Filebeat Kubernetes provider watches the API for changes in pods. When a new pod starts, it will begin tailing its logs; and when a pod stops it will finish processing the existing logs and close the file. By default it watches all pods but this can be disabled on a per-pod basis by adding the pod annotation co.elastic.log/disable: 'true'. Filebeat has access to any given pods metadata, allowing it to enrich log events with useful data such as all the pods’ labels and their values. You can also optionally include any pod annotations you’d like to the event, as we’re doing above with autotrader/logging
The hints are something we’ll cover a bit further down.
    processors:
    - add_cloud_metadata: ~
    - drop_event:
        when:
          not:
            equals:
              kubernetes.annotations.autotrader/logging: 'true'
Specifying processors in this top-level config means we can apply some default processing to all logs that the provider picks up. We’re running Kubernetes using Google’s Container Engine (GKE) and helpfully Filebeat is able to detect when running on a public cloud provider and can further enrich log messages with cloud metadata (Project ID, availability zone etc.)
Even better though is that we can drop messages based on the content within them, allowing us to create our opt-in logging model. A user simply needs to add the annotation autotrader/logging: 'true' to their deployment pod template to get their log messages into Elasticsearch, instead of them being dropped.
Hints
We’ve now got our logs conditionally being sent to Elasticsearch based on the presence of an annotation, but we’ve not yet tackled providing some better parsing of those log messages. This is where the hints based discovery comes in.
Hints are a feature of Filebeat that let users further customise their logging through simple annotations in their pod spec. An exhaustive list of available annotations can be found in the Filebeat docs but below are a couple of examples demonstrating how these annotations can be used:
My logs contain a lot of spam, I only want to log ERROR messages…
co.elastic.logs/include_lines: '^ERROR'
My logs contain a JSON object that spans several lines…
# A line that begins with a space is indicative that it is
# part of the previous message
co.elastic.logs/multiline.pattern: '^[[:space:]]'
co.elastic.logs/multiline.match: 'after'
# The log entry ends at the end of the JSON object
co.elastic.logs/multiline.flush_pattern: '^}'
Through a few simple annotations, we can begin to correctly ingest the majority of our log messages. This is great you’ll hopefully be thinking: but it’s a bit of a pain if a user needs to specify processing rules in every deployment, and even then we’re still not parsing the actual message field into meaningful content. There’s not that many log formats, perhaps we can make it even easier for the end user.
Filebeat Modules
Fortunately, we can take things one step further, using modules. If you read the autodiscover docs linked above you may have seen an annotation for co.elastic.logs/module.
Filebeat modules are prepackaged definitions for how a given log format should be parsed. They can include processing rules for log lines with different rules for different ‘filesets’ (i.e. stdout vs stderr), Elasticsearch field mappings & premade dashboards for Kibana.
I won’t go through a full example of creating a module since there are quite a few files you have to fiddle with, but following this guide got us to where we wanted to be. We used the official Filebeat Docker image and built on top from there.
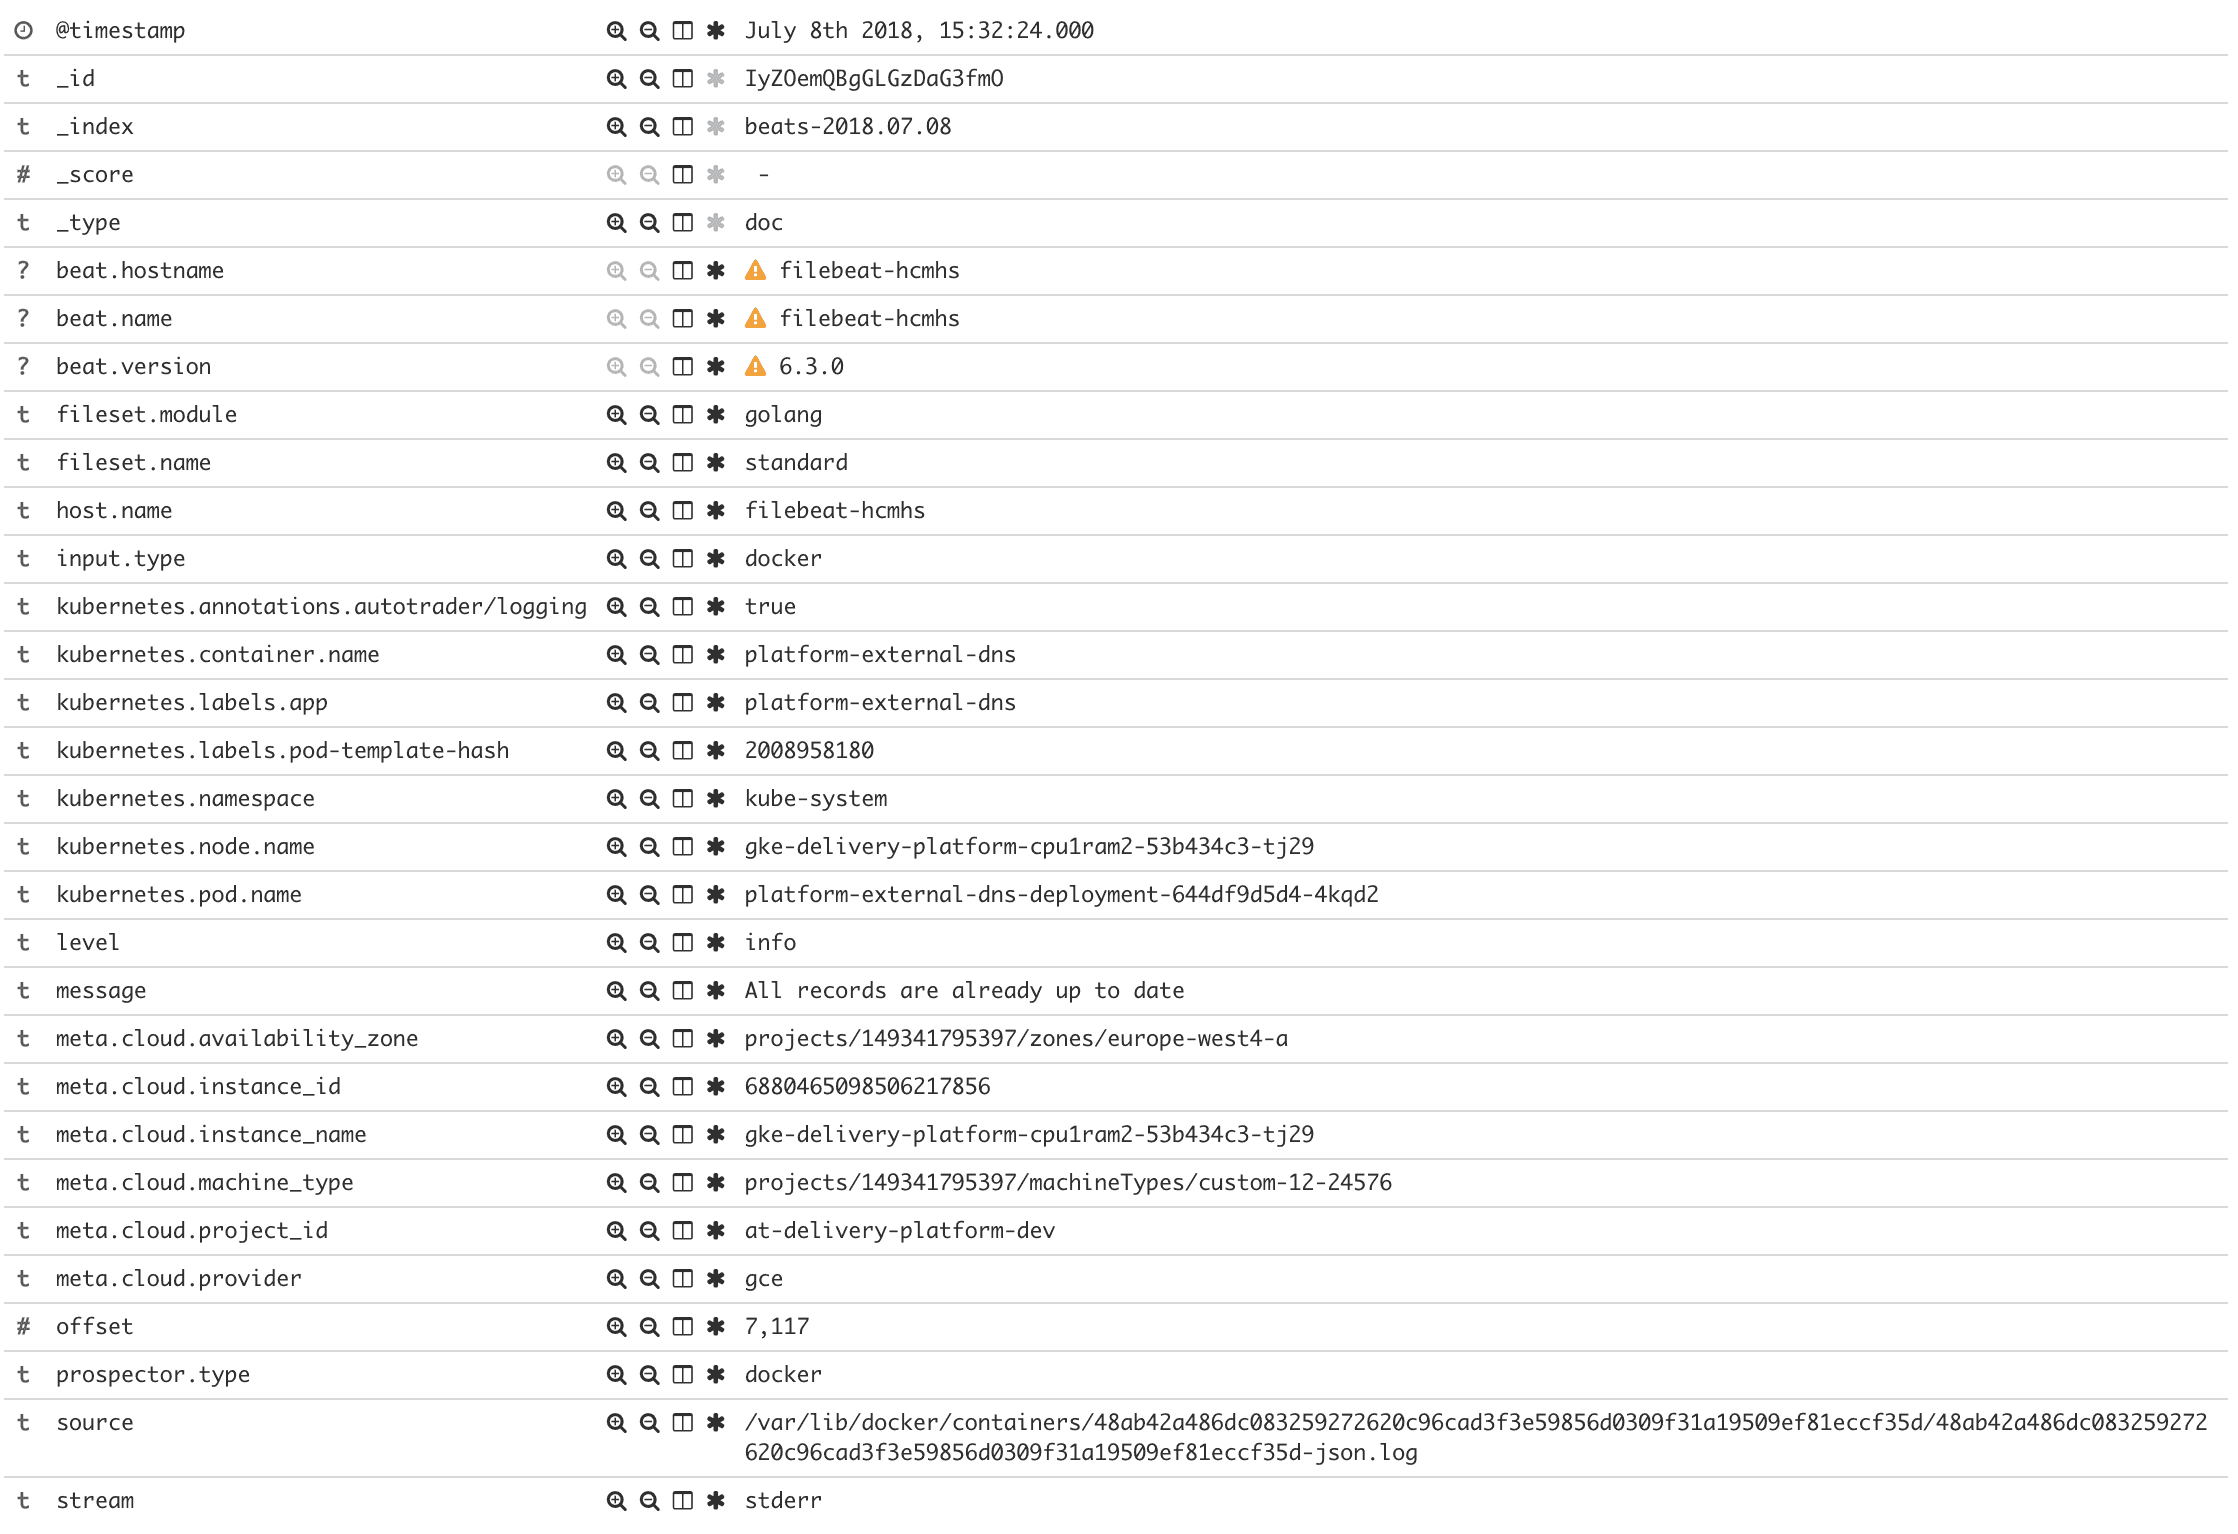
Let’s take the below log line as a basic example of how modules can help:
time="2018-07-08T14:13:35Z" level=info msg="All records are already up to date"
Currently, this would be ingested into Elasticsearch as is, the message field would simply be the entire log line. Ideally, we want to split this out; derive the timestamp from the time in the log line, split the log level into its own field, and keep the message on its own.
As part of creating a module, we can define an ingest pipeline definition that should be used to process the logs. Ingest pipelines are run on Elasticsearch ingest nodes before a document is indexed, they’re almost like a Logstash-lite built into Elasticsearch.
From our example above let’s create some simple processing rules:
{
  "description": "Pipeline for parsing example logs",
  "processors": [{
    "grok": {
      "field": "message",
      "patterns": [
        "time=\"%{TIMESTAMP_ISO8601:timestamp}\" level=%{LOGLEVEL:level} msg=\"%{GREEDYDATA:message}\""
      ],
      "ignore_missing": true
    }
  },
  {
    "date": {
      "field": "timestamp",
      "target_field": "@timestamp",
      "formats": [
        "ISO8601"
      ],
      "timezone": "UTC"
    }
  },
  {
    "remove": {
      "field": "timestamp"
    }
  }
],
  "on_failure" : [{
    "set" : {
      "field" : "error.message",
      "value" : ""
    }
  }]
}
- Grok Processor: Parse the log line into three distinct fields;
timestamp,level&message - Date Processor: Parse the time from the log entry and set this as the value for the
@timestampfield - Remove: Drop the
timestampfield since we now have@timestamp
Now that we’ve created a module in Filebeat and given it a name, i.e. example-module, users can make use of it by specifying it in their annotations: co.elastic.logs/module: 'example-module'.
This is great because we can create generic modules for different log formats (Common Log Format, logfmt etc.), taking the burden of writing parsing rules off the end user.
Finally, you can sit back and bear the fruits of your labour; meaningful, rich & structured logs.
Considerations
With all the above in mind there are a few things to consider with this implementation:
- Using the above resource definitions Filebeat will not automatically pickup config changes. If you’re using Helm you can have pods restart on Secret/ConfigMap changes with this method. Alternatively, you could enable Filebeat’s automatic reload option.
- Most of the Filebeat features outlined in this run through are classed as beta or even experimental, so you may choose to opt for a more mature solution.
- If you’re using modules with ingest pipelines keep an eye on Elasticsearch to ensure you don’t degrade search/index performance. You could consider running dedicated ingest nodes if you’re ingesting a lot of documents.
- When you change an ingest pipeline in a module the definition within Elasticsearch is not updated with the changes, you need to run
filebeat setupto force the update.
In Summary
Hopefully, this has given a taste of how you can streamline your Kubernetes logging.
If you have any questions or suggestions for improvement feel free to get in touch on Slack: evesy @ kubernetes.slack.com.
Enjoyed that? Read some other posts.
Related Posts
21 Jul 2022—Chris Gillatt
Photo by Markus Spiske on Unsplash
At Auto Trader, we keep our Kubernetes clusters up-to-date to the latest or T-1 version available in the Google Kubernetes Engine ‘stable’ release channel. We run large clusters (450+ workloads,...
