Using AWS Lambdas for data lake monitoring
Here at Auto Trader, a core part of our strategy is to help improve the process of buying and selling vehicles through the provision of data driven intelligence. This data driven approach isn’t just something we suggest to our customers; we also use data internally to drive our product development. For example, our product teams use KPI dashboards when adding new features or developing new products to ensure that they’re making informed decisions. The data that drives these dashboards needs to be correct, and we need to know if anything goes wrong.
Historically, the KPI dashboards would be manually curated, a time-consuming process that’s prone to human error. As we develop our data lake platform, we’ve begun to automate the production of the data that powers these dashboards. The data lake splits data across zones; each zone contains data that has undergone a different level of processing. In our implementation, the data powering the KPI dashboards is written to the refined zone, alongside other data that has undergone deduplication, joining, and aggregation. This typically happens on a scheduled basis, i.e. daily, weekly, etc. Given the importance of this data, we decided to monitor the refined zone to become aware of issues as soon as possible.
What do we want to monitor?
To ensure the KPI data in the refined zone is present and correct, we determined that there were two attributes that we should monitor:
- Data recency – is the data added to the refined zone at the expected time? This is straightforward to monitor - we can check the timestamp of the most recently added data.
- Data integrity – are the contents of the data as we would expect? This is more complicated, since there are many potential attributes to monitor. As a first pass, we determined that checking the file size of the most recent data point, and comparing it to previous data points would catch any catastrophic errors.
Monitoring approach
Our data lake processes, including the generation of refined data for our KPI dashboards, are scheduled using Apache Airflow. This provides us with the capability to schedule checks and tests to run following the data processing task. Airflow can send emails to alert on task failure and provides an interface allowing us to view failed tasks and restart them if necessary. So why don’t we write our scheduled data integrity checks in Airflow as an additional task? One good reason not to do so is that the cause of a data failure might be our Airflow instance itself. For example, if our Airflow instance goes down and fails to recover, then our data processing wouldn’t occur and neither would our monitoring/alerting task. Maintaining a higher degree of separation between our data processing and our monitoring ensures that we would be alerted even if Airflow was down.
Why use AWS Lambdas?
Given each of our monitoring tasks are small and self-contained, AWS Lambda appeared to be a good alternative to running our monitoring steps via Airflow. Lambdas are serverless functions that execute via triggers and scale automatically.
Lambdas can be configured to run on a schedule using a cron-like syntax. Alternatively, they can be triggered on S3 events such as object creation. Since our data lake is backed by S3, this means that integrity checks can be performed each time a new file is added to the lake, ensuring that the alert is instantaneous. Triggering on S3 events also means that our integrity check runs once and only once for each file in S3, unlike a schedule-based integrity check which would have to check every file on every run, which is inefficient, or maintain a list of files already checked, which adds complexity.
Language choice
AWS Lambda supports a variety of languages – Node.js, Python, Java, C#, or Go. As a team, we have strong experience with Python and Java, and while either language would have been suitable, we opted to use Python due to:
- Better support for numerical analysis
- Smaller packaged artifact
- Lower start-up time
- Better documentation for developing Lambdas
For development, we set up a Docker container running the correct version of Python, and with the Boto 3 package installed. This allowed us to mimic the server environment on which Lambdas are executed, and enabled us to run automated tests as part of our build pipeline.
AWS CloudWatch
An important part of our Lambda infrastructure is how we tie in the monitoring functions with alerts — for this, we use Amazon CloudWatch. Using CloudWatch, we can post metrics from our applications, and configure alarms to trigger if our metrics exceed a threshold. CloudWatch allows us to chart the values of these metrics, so that trends can be monitored.
Monitoring data recency
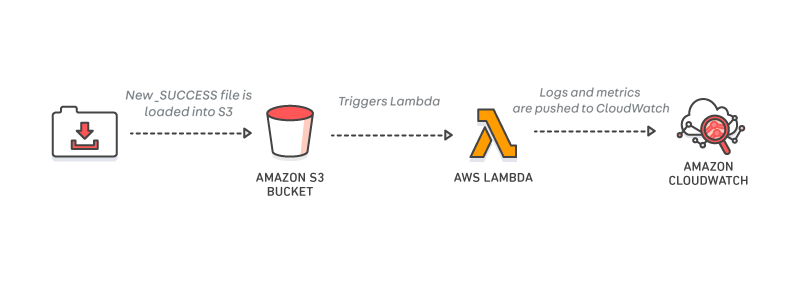
To monitor data recency, we created a schedule-triggered Lambda, set to run once per day, after the task that processes and moves the data into the refined zone. The aim of this Lambda is to check whether the data has been successfully moved into the refined zone at the expected time, to ensure that any subsequent tasks or processes that rely on this data don’t run into any issues. To perform this check, the Lambda verifies the presence of an expected file – in this case, we expect a file called _SUCCESS to be added to a date-specific folder on the S3 path. If the file isn’t there, an exception is thrown that can be viewed in the CloudWatch logs, and a metric is automatically posted to CloudWatch. Note that, although triggering lambdas based on events is the ideal, this lambda must be triggered on a schedule since its intention is to raise an alert if the event does not happen.
Monitoring data size
From analysing previous runs of our KPI data processor, we know approximately how big the produced data files should be, and more importantly, what the file size is if a run wasn’t successful. We created a Lambda function to calculate the total size of produced data files for a given day, and to post the result to a CloudWatch metric. Since we expect a variation in the data file size from day to day, we also created a Lambda to calculate the difference in total file size compared to the previous day’s data. Both of these Lambdas trigger on S3 object creation, so metrics are posted to CloudWatch as soon as the data is produced.
The code snipped below shows how we post the TotalFileSize metric to CloudWatch, using the Python Boto 3 library.
cloudwatch = boto3.client('cloudwatch')
cloudwatch.put_metric_data(
    Namespace='ATUK/Lambda',
    MetricData=[
        {
            'MetricName': 'TotalFileSize',
            'Dimensions': [
                {
                    'Name': 'BucketName',
                    'Value': bucket_name
                },
                {
                    'Name': 'Key',
                    'Value': key_prefix
                },
                {
                    'Name': 'FunctionName',
                    'Value': 'file_size_check'
                }
            ],
            'Timestamp': time.time(),
            'Value': total_file_size,
            'Unit': 'Bytes'
        },
    ]
)
Deployment
Having written our Lambdas, we need a way to deploy them to AWS as part of our Continuous Integration pipeline. For this we used Terraform – a tool that lets us define our cloud infrastructure as code; the docs on creating AWS Lambdas with Terraform can be found here.
Creating alarms from metrics
Using CloudWatch, we can create alarms to detect when certain metrics cross predefined thresholds in either frequency or value. We created alarms to monitor the metrics produced by our Lambdas, and detect when any error metrics are posted, or when the metric value drops below a certain threshold. We also used Terraform to configure the alarms as code, and to add them to CloudWatch. The code snippet below shows how we configured an alarm to trigger when the total file size drops below a threshold of 195000 bytes.
resource "aws_cloudwatch_metric_alarm" "file_size_check_alarm" {
  alarm_name = "${var.alarm_name}"
  comparison_operator = "LessThanThreshold"
  evaluation_periods = 1
  metric_name = "TotalFileSize"
  namespace = "ATUK/Lambda"
  statistic = "Average"
  period = 300
  threshold = 195000
  alarm_description = "${var.description}"
  dimensions = {
    FunctionName = "file_size_check"
    BucketName = "${var.bucket_name}"
    Key = "${var.key}"
  }
}
Future steps to alerting
While we now have a set of alarms in CloudWatch, we haven’t yet configured them to alert us when things go wrong. Currently, the only way for us to know when an alarm is triggered is to keep an eye on the charts in CloudWatch, which isn’t ideal. One of the reasons for this is that there are many different ways in which alerting is configured across the business, and it felt like picking one without more knowledge wouldn’t be the best way forward.
One potential option would be to hook CloudWatch up to Amazon Simple Notification Service (SNS). SNS is a publish-subscribe messaging service that would allow CloudWatch to publish messages to a topic from which several subscribers can read. In our case, a possible subscriber could be a service that sends out an email to our support inbox when one of our metrics crosses a certain threshold, or even another Lambda function that kicks off a task in an attempt to correct whatever has gone wrong.
Another option would be to link CloudWatch up with Grafana, an open source tool for time series analytics, which is both easy to use and well known in the business. Grafana has built-in support for CloudWatch so the two can be hooked together – CloudWatch needs adding as a data source, enabling us to build dashboards using CloudWatch metrics. These dashboards would allow us to analyse and visualise the metrics. Grafana also includes an alerting engine, from which we would be able to send alerts for any data abnormalities.
We’ll keep you posted with another blog post once we settle on an alerting solution.
Enjoyed that? Read some other posts.
Related Posts
19 Jun 2024—Stevie Woods and Philippa Main

Data underpins and helps to drive every part of Auto Trader’s business. With over half a million listed vehicles and 1.4 million visitors to Auto...
05 Apr 2024—Bethanie Garfin
Photo by Kenrick Baksh on Unsplash
At Auto Trader, the behavioural events we collect about our consumers are a core part of our data platform, fueling real-time personalisation on-site and reporting our core business KPIs. Because...
