Cultural Learnings of Data Academy for Make Benefit Glorious Company of Auto Trader: or how we're promoting data literacy.
At Auto Trader, we are attempting to democratise our data.
We put together a team of data engineers, signed up to AWS, built a Data Platform, replaced all the components at least once because they weren’t up to scratch and, having done all that, finally realised we needed some people to use it.
Luckily, as we were progressing, we engaged with our potential users, who provided plenty of interesting problems for us to work on. Unfortunately, we will never have enough time to generate the code to answer all of the questions those developers, analysts, scientists, business and sales folk have, so we’ll need them to self-serve.
The main problem is how steep the learning curve is, even for our skilled Java developers. We’ve built a range of entry points on our Data Platform, hoping there will be at least one suitable for each of those groups, but the related technologies are not things that you can pick up in a day. The concept of a “schema-on-read data layer with associated at-scale-compute capability” is utterly alien to most of our organisation (including developers). We’re used to using SQL, a clean relational database and clearly defined structures; all carefully looked after by our data warehouse team. Compared to this, the new platform is positively Wild-West.
To this end we’ve decided to start our own data academy— we all need to go back to school!
Where we are
From the start, we decided to split our user community into six personas:
- Scientist
- Analyst
- Developer
- Product Manager
- Technical Support
- Customer Development (aka Sales)
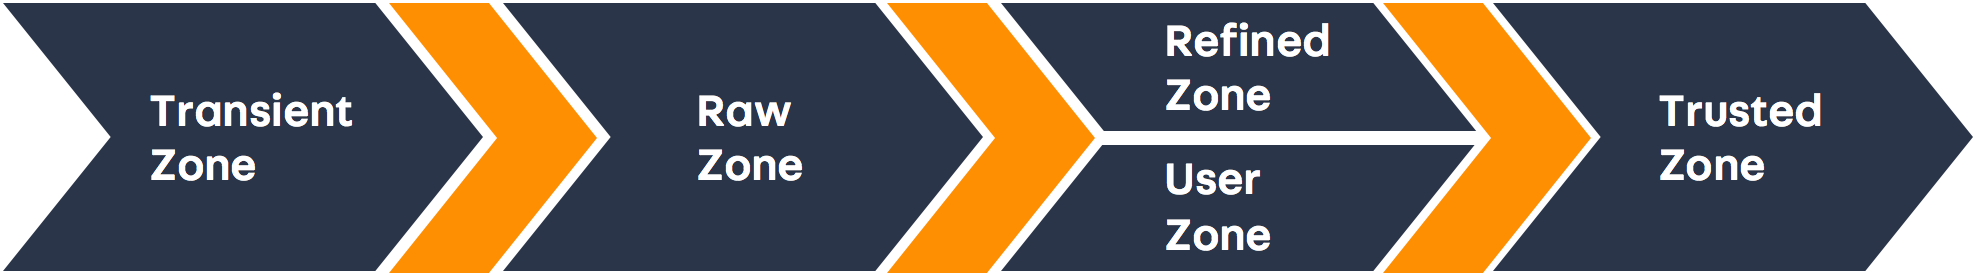
As well as designing the capabilities delivered by our platform to meet the needs of these customers, we’ve also split the data into five zones:
- Transient— our landing zone, where no-one goes
- Raw— pure, unfiltered data, in its dirtiest form
- Refined— joined, cleaned and aggregated; high enough in volume that trends can still be discovered, but filtered enough to remove anomalies
- User— the only space that can be written to by the Data Platform users (only full ELT processes can write to the others), be-it scratchpads or temporary team datasets
- Trusted— fully abstracted from the data’s source (operational) system, described in an Auto Trader specific domain language, ready for publication and exploitation.
These zones flow into one another, becoming increasingly abstract while decreasing in object volume— each zone containing data derived from the previous one (ish!).
Each tool/capability is targeted at one or more of these zones and personas.
For example, Databricks is mainly used by our Analytics Group. This is made up of Scientists and Analysts, who spend the majority of their time in the raw and refined zones, respectively. They look for new insights and trends and then produce the models that make them real. The outputs from these analyses are usually written to the user zone.
Our developers create ELT processes written in Scala/Spark and use Airflow to schedule their tasks. These ELT processes create datasets based on the requirements of their team’s products or the Analytic Group’s insights. The outputs of these are written back to the raw, refined or trusted zones.
At the moment we’re thinking that our less-technical users will be using Athena and/or BigQuery with Looker to query data and generate, render and view dashboards built from the refined and trusted zones. This will require some of them to learn SQL, but all to pick up some basic data concepts.
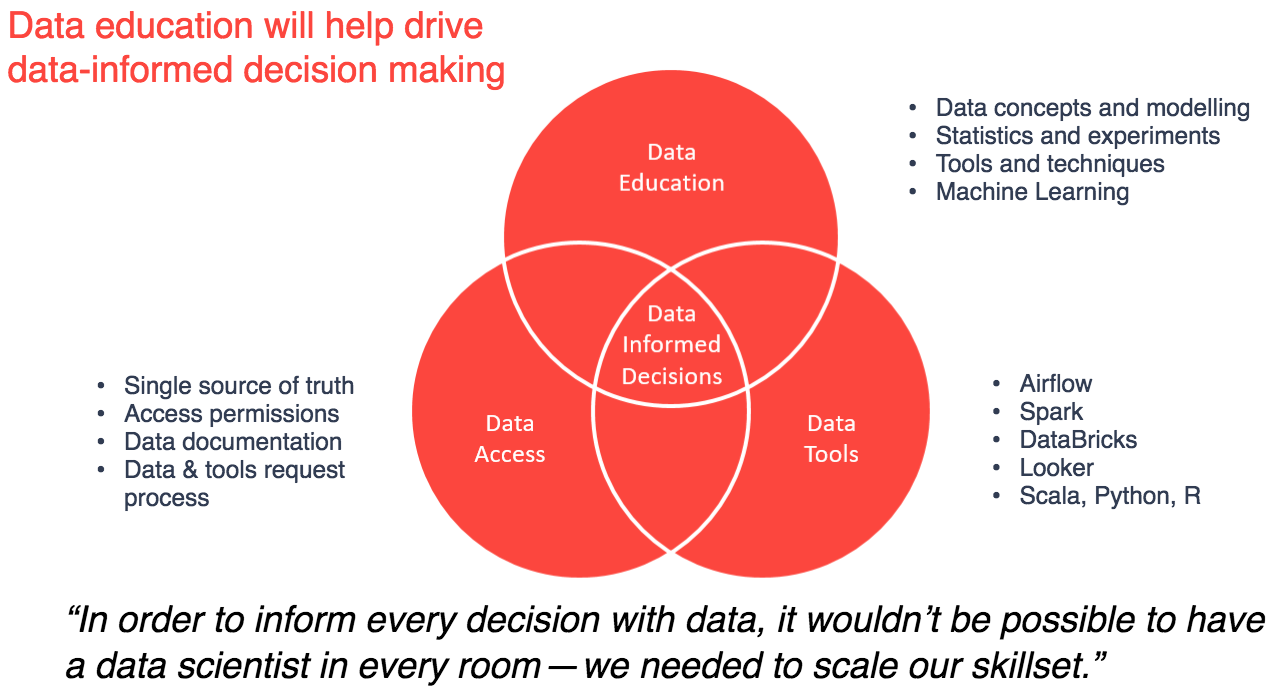
Each of these communities needs supporting in picking up skills for their toolsets.
Many of us are not knowledgeable about statistics. Most are barely aware of basic machine learning techniques. Our Scientists and Analysts may know the difference between MANOVA, SoftMax and Linear Regression, but they aren’t, as a whole, comfortable with churning out tested, production quality code.
We all have a lot to learn.
Where we want to be
Ideally, we would like everyone at Auto Trader to be able to find (or indeed create) the data that they need, when they need it, without any help.
We would like people to be knowledgeable about our data, its lineage and intent so that they can be confident in their conversations with our customers and partners.
Our Customer Development teams often use data to back-up the assertions they make in conversations with customers. It would be great if we could know what they use and how. It would be even better if they could fully trust the data that they use and where it has come from.
When someone talks about an Advert, we would like it if everyone was talking about a page on the site, rather than, say, a paid for advert-slot as part of a customer’s monthly subscription. When we talk about Response, it would be great that everyone knew if the numbers they were sharing were filtered for bots or not.
If a Product Manager is trying to join Customer to Stock (not Advert!), they should know, first, what a primary key is, and second, which foreign keys they can link to.
It should be obvious, to those that need to care, what the differences are between, and when to use, a snapshot dataset, an append log or an event stream.
This is maybe a bit of a moonshot.
How we’re going to get there and what we’ve done so far
In a shameless act of plagiarism, we decided to “take inspiration” from AirBnB’s Data University. This has involved analysing the questions raised as we roll out the platform and generating courses that neatly cluster the root issues together.
Rather than start with a scattergun approach, we carefully thought about our most engaged teams and invited key early adopters from them to attend the initial courses. The hope was that they would not only go back and educate others in their area, but we could snowball out along paths of least resistance by getting them to nominate others that would benefit from attending.
Once we had enough of a community contributing to our #data-platform Slack channel, we felt comfortable to start advertising the courses more widely. The thinking was to involve others in answering the support questions, rather than us having to pick everything up. It has worked quite well, with most questions responded to in a matter of minutes, often by someone who isn’t a data engineer.
We decided next to direct our efforts towards Analysts, our core users. This community is used to using SQL, R and a bit of Python. Luckily Databricks supports all three of these, so we offered an introduction to Python and notebooks (the family of tools that Databricks sits in, which includes others such as JupyterHub and Zeppelin).
At this point, we had reached most of our initial audience, so we thought we should expand the curriculum to accommodate others.
In true Lean style, we generated several module titles with very little (if any) content behind them. We waited for people to ask if they could attend a module before putting the work in. Many of the modules are still missing content.
We’ve structured the modules in the classic 100, 200, 300 US university style and added dependencies were necessary. Most people start with 101 - “Introduction to the Data Platform” and then move onto more specialist topics.
In the “Introduction to the Data Platform” and notebook classes we’ve also run developer-focused sessions to help with productionising and deploying data pipelines. We have a module that is designed to help less-technical staff access data via Athena (and soon Looker).
We also offer to lend one of our developers to help coach teams who want to develop new capability on the platform. This is usually for a limited period, to build the first slice of the desired functionality. We then ask them to use the existing community to help with further work.
What we’ve learnt and what to do next
We’ve realised that this is hard, takes a lot of time, and we’ll probably never finish.
So far all of the modules have been run by data engineers, but we hope to involve our analysts and scientists to help with the more mathematical courses. So far, once past a certain level of capability, everyone has managed to self-teach, but we suspect that will only get us so far.
Aspirationally, we hope to roll out any relevant tools and related courses to all members of our company. This means that we will need to integrate the data modules into our company’s general Academy. This would allow us to teach modules to our Graduates, apprentices and new starters, as well as identifying colleagues that might need further knowledge. We’re a way off this yet, but we’re thinking of that goal as we build modules.
One advantage of working with our company’s Academy is that they teach as part of their job. Developers are not naturally confident at presenting and less so teaching their non-technical colleagues. A few of our data engineers have taken on most of the teaching work but this will not work long term. Leveraging the professional services of the Academy might help ease this tension. This should also help with the Dreyfus Squared issue.
We were initially concerned that some colleagues could be afraid that our tools might “optimise” their jobs. The first project we built on our growing platform, was to help customer development staff better target their conversations with retailers. This took a diverse set of data and generated “next best conversations” for sales to have with customers. It was generally disliked and quickly pulled. It should have been, with hindsight, obvious that taking a parental tone, backed by AI, was never going to land very well. We now provide automated assessments and aggregations of customer data, leaving the decision-making to the people who talk to our customers. As we become more effective at this we’re starting to see some real-time savings without alienating anyone—in fact, quite the opposite—everyone seems excited to start using it, seeing the advantage that the insight gives them.
Enjoyed that? Read some other posts.
Related Posts
19 Jun 2024—Stevie Woods and Philippa Main

Data underpins and helps to drive every part of Auto Trader’s business. With over half a million listed vehicles and 1.4 million visitors to Auto...
05 Apr 2024—Bethanie Garfin
Photo by Kenrick Baksh on Unsplash
At Auto Trader, the behavioural events we collect about our consumers are a core part of our data platform, fueling real-time personalisation on-site and reporting our core business KPIs. Because...
05 Oct 2023—Tim Summerton-Brier, Stevie Woods, John Harrison
Photo by Tico Mendoza
Back in April, Auto Trader gave a few of us the opportunity to attend Data Council 2023 in Austin, Texas, USA. Data Council is an independently curated conference that covers many aspects of working...
17 Apr 2023—Olivia Pennington & Tom Armitage
Photo by Nik Shuliahin on Unsplash.
You’ve done the hard work in researching, developing and finally deploying your shiny new Machine Learning (ML) model, but the work is not over yet. In fact it has only just...
24 Mar 2023—Tom Armitage & Olivia Pennington
Photo by Stephen Dawson on Unsplash.
Advertising packages are the core product at Auto Trader. Depending on the package tier our customers purchase, they get to appear in...
