View from across the data lake: Developing the mileage indicator using our self-service Data Platform
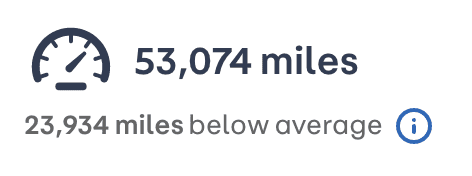
The mileage indicator is a new feature on our product page which shows how the mileage of an advertised vehicle compares to the average mileage of similar vehicles that we’ve seen on Auto Trader. It uses machine learning (ML) to predict what the mileage of a vehicle should be given its age. The ML model is trained on data from the millions of recently seen vehicles that we record in our S3-backed data lake.
I’d like to share the story of how the mileage indicator was built, from prototype to production, and finally to fully automated retraining and continuous deployment of the model. It is a microcosm of how we work at Auto Trader: centring our business around our data and using its insights to drive product design.
1. Leaving our product team’s Java web development comfort zone to implement a machine learning product
We wanted to utilise machine learning to get the most accurate mileage predictions possible. As a Java developer working on a modern website, I’d already extended my skillset beyond the Java ecosystem to technologies like React, GraphQL, TypeScript and Node. Building products using machine learning was another exciting step out of my comfort zone!
At Auto Trader, we have a team of data scientists and data engineers who are experts in developing and maintaining our Data Platform. Our data engineers pair with product team developers as a knowledge-sharing exercise. However, this time our teams’ priorities didn’t line up, so we had to drive the data engineering aspects of the work forward ourselves. This was a good test of the work that has been done to promote data literacy and facilitate a self-service Data Platform.
Auto Trader’s Data Platform has been developing over the past few years and, now in its maturity, there are tried and tested patterns for building and integrating machine learning products into our applications.
The Data Platform gave us the capability of creating a mileage indicator prototype using Spark ML via a Databricks notebook. We required a data scientist to write the first version of the notebook since machine learning expertise was needed. These surprisingly few lines of Spark ML code are the crux of the mileage indicator and were written in a matter of days if not hours. The artifact generated by the notebook is a zip file in a portable MLeap format, which contains an ML pipeline and execution runtime, capable of returning predictions without the full Spark infrastructure.
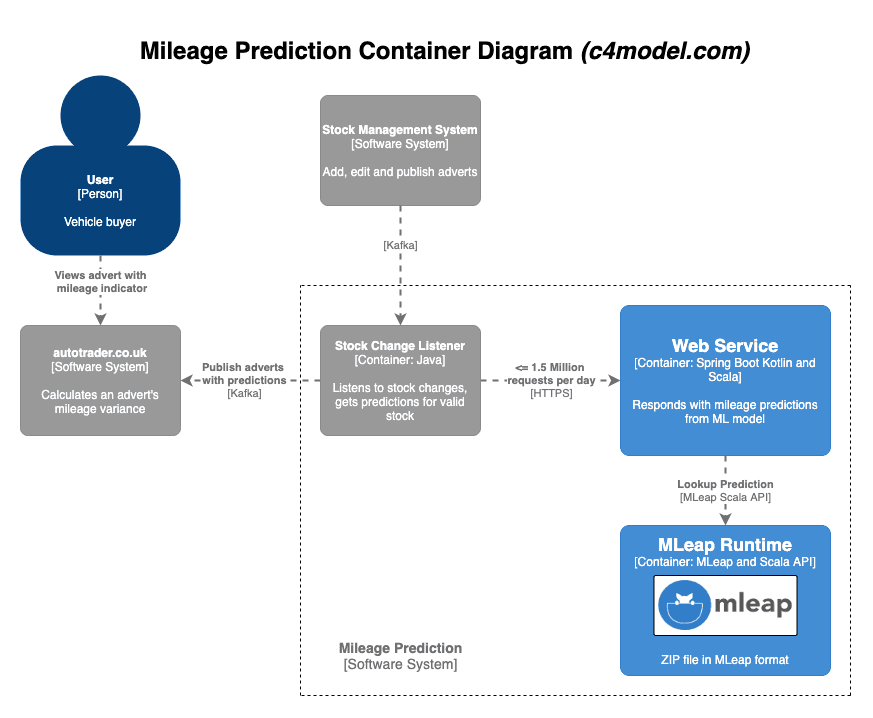
Now we could make this model available to our applications via a web service. At this point there was no integration with the Data Platform; we simply copied the MLeap zip file into our web service. To get these predictions onto our product page, we needed to do some plumbing. Every time a new stock item (a vehicle which may later become published to autotrader.co.uk) arrives in Auto Trader’s system or is changed, we request a predicted mileage from the web service and update the stock item. This event-driven architecture is powered by Kafka. To give a sense of scale, the web service receives up to 1.5 million requests per day.
The Data Platform had given us the capabilities to create and deploy the prototype notebook in a short time frame, meeting our deadlines. Now the real fun could begin…
To keep the mileage predictions fresh, we wanted to retrain the model regularly. To maintain an accurate prediction we decided on a monthly retraining schedule. Each month would look back at the latest year’s worth of data. To avoid manually retraining the model and copying the file into the web service, we could utilise more of the Data Platform’s capabilities to fully automate this process. The productionisation process involves converting the Databricks notebook to an Extract Transform Load (ETL) job. The production code resides in a git repository which is deployable and covered by unit and integration tests.
Still lacking dedicated support from our data engineers, the suggestion was made for me to complete this work by sitting with the data engineers. Embedding myself with them meant I was surrounded by people who could help answer the minor questions that would regularly come up during implementation.
2. Discovering and self-serving the Data Platform capabilities
The data engineers are on a journey towards self-service. The evolving support options available to me were numerous:
- a Data Handbook providing an overview of the platform, how-to guides and links to relevant resources.
- the Data Academy and workshops including how to convert a Databricks notebook into an ETL job which I had previously attended.
- Architectural Decision Records providing context about the architecture of the Data Platform.
- Auto Trader Engineering Blog posts such as the ones I’ve linked to throughout this post, describing architecture and usage patterns.
- a support mailbox triaged according to urgency (code reviews and merge requests are high on the list).
- a Data Platform Slack channel where anyone in the channel can provide help.
- of course, nothing beats being able to have a face to face conversation with the data engineers who are eager to help and collaborate with their product team users.
While writing the mileage indicator ETL job, I utilised all of these options. One difficulty, as with any seasoned codebase, was distinguishing legacy patterns from the latest best practices. This is where being stationed within the team helped.
I ran into various nuances of the Data Platform along the way such as:
- Amazon S3 is eventually consistent. The consistency guarantees need to be considered when you’re reading data.
- Spark transformation function naming conventions.
- MLeap bundles cannot be saved directly to S3. They have to be saved to the ETL job’s environment, uploaded to S3 separately, then deleted from the environment.
- ensuring the library versions used in the Databricks notebook are compatible with the production code. The MLeap, Spark and Scala library versions are tightly coupled so its a balancing act to keep them in sync in a monorepo where upgrading one may have a large impact on other ETL jobs.
- how Apache Airflow, our ETL job scheduler, handles execution dates can sometimes be confusing.
The Airflow
execution_dateis used to feed a date to the ETL job so that it knows which date to read data until. In your ETL job, if you want to include the latest full day of data, you need to read up to and including yesterday’s data. If you are scheduling a daily job then the Airflowexecution_dateis set to the day before the cron job runs, which is yesterday’s date. If you are scheduling a monthly job, but want to read data up to and including yesterday, then you need to perform this date calculation to get yesterday’s date:(execution_date + 1_month - 1_day). This is because Airflow’sexecution_dateis set to one scheduled interval before the cron job executes.
Once I had completed the productionised ETL job and the Airflow code to schedule it, I now needed to connect all the pieces, integrating the automatically retrained ML model into the web service.
The final parts of any project are often the most painful. As much as you test individual components, there are often teething issues once you hook them up in a real environment. As well as writing out the MLeap model, the ETL job writes out some sample predictions to use as integration test data in the web service. A few rows from the training data itself are used for the sample predictions. After hooking this test data up, we couldn’t get the web service predictions to match the test data expectations.
The problem was that the predictions rely on the age of the vehicle. This is the difference between the vehicle’s registration date and the observation date (the datestamp of the stock record). The sample predictions are dependant on the age of the vehicle and therefore the observation date. However, the web service uses the current date in place of the observation date to derive the vehicle age. After all, this is a realtime prediction rather than historical data. The solution was to write the observation date into the sample test data and alter the web service’s system clock to align the dates.
3. Returning to the product team armed with knowledge for future product development
Since the prototype version of the mileage indicator had been live to 100% of our audience for a while, we’d already received feedback and had some new requirements. The model needed to take into account new data points. Updating the ETL job was easy now that it was productionised.
After the final end-to-end creases were ironed out, all that was left was ensure the Airflow task executed on its monthly schedule. It was a thing of beauty to witness those few lines of Spark ML code retrained against a fresh data set, run integration tests using the new data, trigger the continuous deployment of the web service and start serving the predictions for our live adverts.
This is the power that a well-architected Data Platform can wield to support the development of maintainable data-driven products.
Gaining this hands-on experience meant that I was able to spread the data literacy and data engineering practices within my team. Next time we want to build a data-driven product we will need even less support from the data engineers, which frees them up to support other teams and enables our team to go faster.
Until then, it’s time to sit back and watch the predictions (or alerts!) roll in.
Enjoyed that? Read some other posts.
Related Posts
19 Jun 2024—Stevie Woods and Philippa Main

Data underpins and helps to drive every part of Auto Trader’s business. With over half a million listed vehicles and 1.4 million visitors to Auto...
05 Apr 2024—Bethanie Garfin
Photo by Kenrick Baksh on Unsplash
At Auto Trader, the behavioural events we collect about our consumers are a core part of our data platform, fueling real-time personalisation on-site and reporting our core business KPIs. Because...
05 Oct 2023—Tim Summerton-Brier, Stevie Woods, John Harrison
Photo by Tico Mendoza
Back in April, Auto Trader gave a few of us the opportunity to attend Data Council 2023 in Austin, Texas, USA. Data Council is an independently curated conference that covers many aspects of working...
17 Apr 2023—Olivia Pennington & Tom Armitage
Photo by Nik Shuliahin on Unsplash.
You’ve done the hard work in researching, developing and finally deploying your shiny new Machine Learning (ML) model, but the work is not over yet. In fact it has only just...
24 Mar 2023—Tom Armitage & Olivia Pennington
Photo by Stephen Dawson on Unsplash.
Advertising packages are the core product at Auto Trader. Depending on the package tier our customers purchase, they get to appear in...
