Demonstrating the Value of our Packages

Photo by Stephen Dawson on Unsplash.
Advertising packages are the core product at Auto Trader. Depending on the package tier our customers purchase, they get to appear in our promoted slots or get an advantage in our search rankings. As a business, we need to know how well our products are performing for our customers, as underperformance could lead to unhappy customers and them canceling their contracts with us. Knowing the impact of a package, not just overall, but on a per customer basis allows us to make sure our offerings are fair, and quickly react to any changes we observe. In order to isolate the effect of package level and to accurately predict a customer’s performance on each product, we had to create our most complex production model to date, Package Uplift. In this blog post, we’ll cover how Package Uplift works and how it builds on our ecosystem of Machine Learning models.
Our Packages and Our Aim
At Auto Trader, our customers can purchase one of several advertising packages. The primary difference between the different levels of advertising package is the degree of prominence given to the customer’s adverts, leading to a greater share of advert views, and faster sales. Over time our approach to delivering these additional advert views has changed, evolving from a simple tiered system to our current approach.
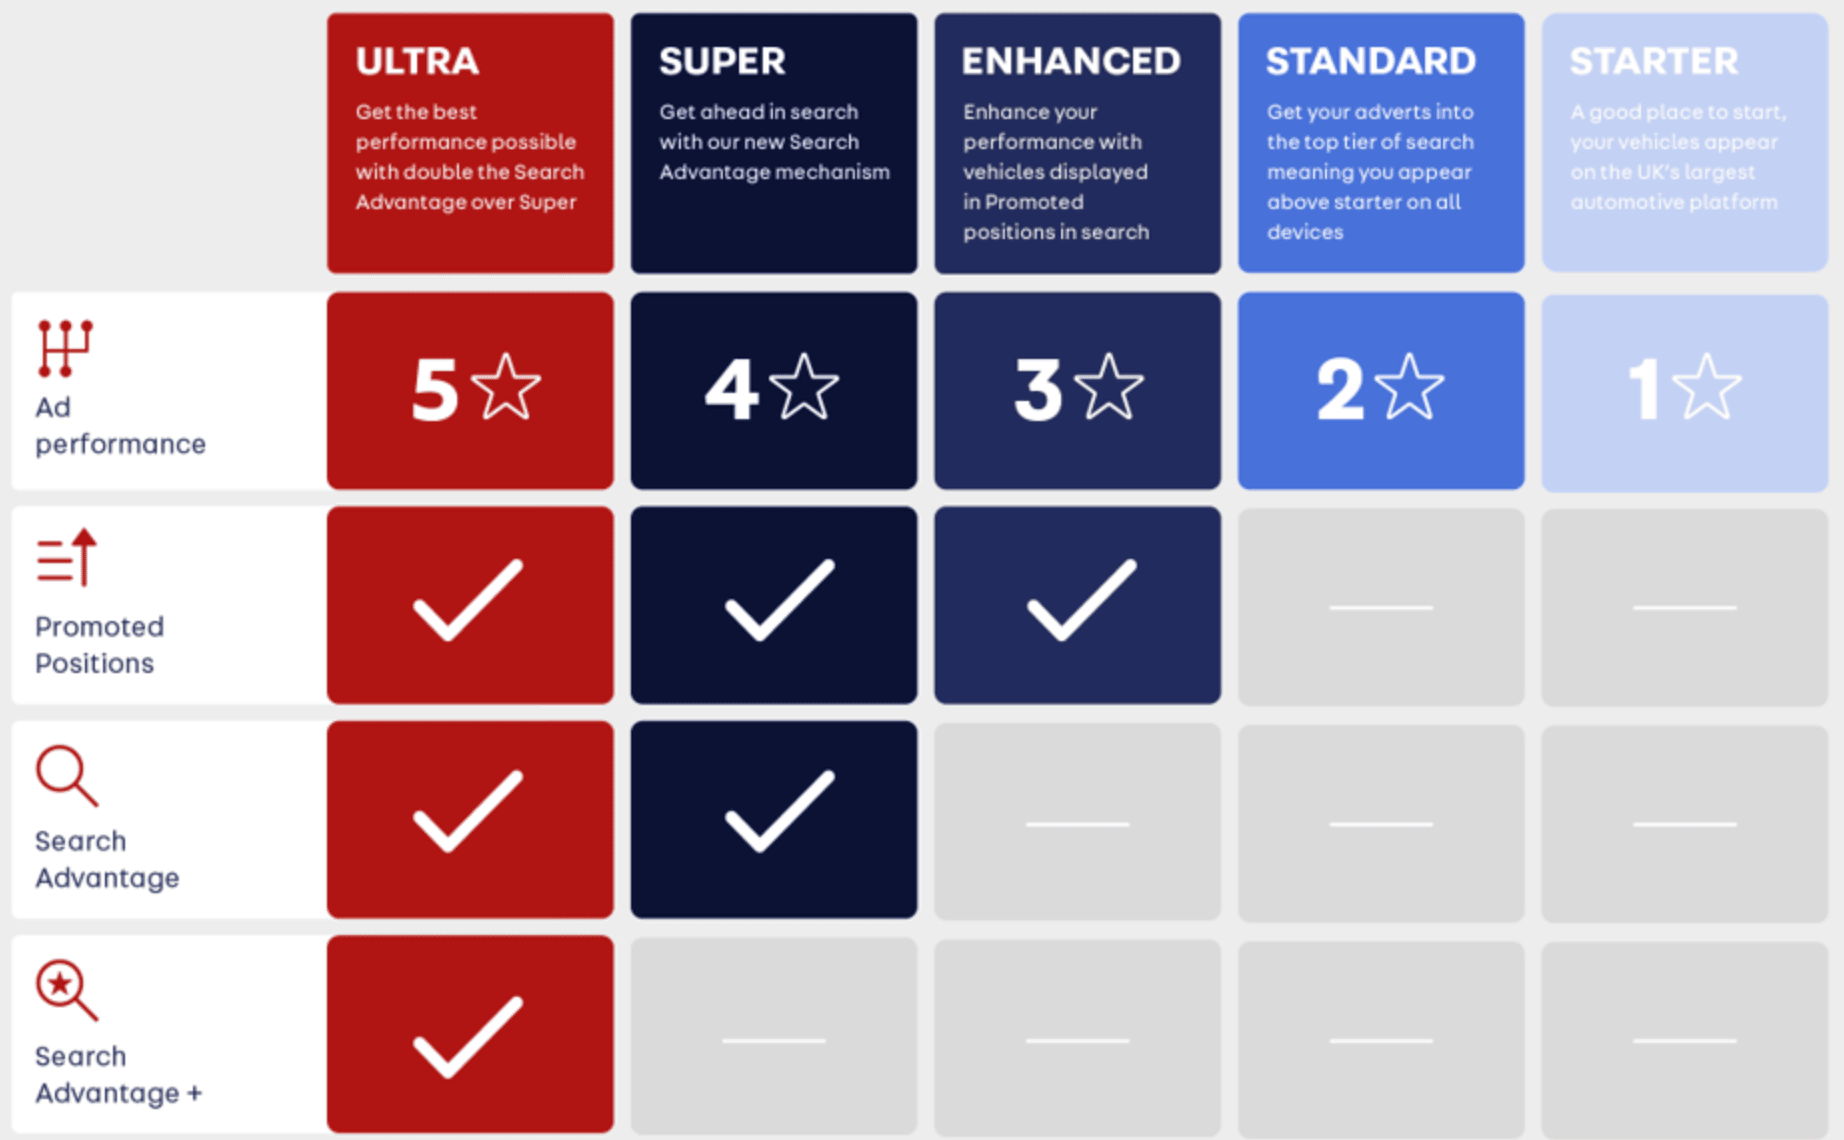
The above chart illustrates the two primary drivers of additional response (search appearances and advert views) with our packages. The first is Promoted Positions. The Promoted Position is towards the bottom of the search results page and customers with an eligible package get a promoted budget each day. The second mechanism is Search Advantage. Search Advantage helps to boost an advert’s ranking in search results, with Search Advantage + boosting adverts on the Ultra package even higher.
With this setup it is critical to understand the impact each package has on all the different types of stock advertised on Auto Trader so we can ensure the impact of Search Advantage is fair. It is also useful for showing customers what they would personally gain from upgrading their advertising package.
What Makes the Problem Difficult
The main difficulty with understanding the impact of package level on advert performance is that a lot of other factors correlate with package level, such as the age and price of advertised vehicles and the type of retailer advertising them.
Above we have a plot showing the average year of registration (essentially the age of the vehicle). We can see that independent retailers have a very different average vehicle age to franchise retailers, and vehicles sold by independent retailers tend to be newer on the premium packages. If we did not account for this in our modelling we may confuse the impact of stock being newer for the impact of the advertising packages!
As is good practice for data science projects, we started with a simple linear model to get a baseline for comparison. In that model, we predicted the number of search appearances adverts get each day. A search appearance is when an advert is shown in a set of search results. Note that the advert must be present on the page of search results, not just eligible to appear.
From the initial results it was immediately apparent that there were problems with the model. As expected, the correlation between features in the model was causing the predicted impact of package level to be inaccurate. To put it plainly, the simple linear model was not able to represent the complex set of relationships between the input features.
While this approach did not yield a good result, it gave us a baseline and justified a more complex approach. Sometimes we find that a simple model is nearly as performant as the best we can come up with, in which case it can be worth using the simple model due to its interpretability and simplicity. Alas, that is not the case here.
LightGBM to the Rescue
Given that we needed a more advanced model for our problem, our attention turned to LightGBM. We shan’t go into the details of how LightGBM works in this post, but it is important to cover some of the key features for our problem.
First, LightGBM is a tree-based ensemble model, creating many small decision trees that focus on aspects where the model is weakest. As a simplified example, if the first decision tree created performed poorly at predicting the response of Audis, the second tree would specialise in Audis. Then if Electric vehicles had the highest prediction error the third tree would focus on those, and so on.
As a LightGBM model is non-linear it should be able to capture the complexity of our situation, where there can be complete deal-breakers for an advert that will drastically limit its performance.
The second key feature is LightGBMs implementation of monotonic constraints. Monotonic constraints allow us to enforce that a given feature increasing in value will cause the prediction to also increase (or stay the same). It can also be enforced the opposite way, with the monotonic feature increasing being guaranteed to lower the prediction. A simple example would be to constrain the price of a vehicle to never decrease with increasing mileage. This functionality within LightGBM is very useful when modelling a system with known rules. In this case, we know exactly what the package mechanisms are, and therefore know that it is virtually impossible for an increase in package level to cause a decrease in response. By enforcing monotonicity for package level we can remove the risk of the model falsely predicting that upgrading the package level will decrease response.
At this point, we must address the big risk with using monotonic constraints. What if our assumptions are wrong, and upgrading an advertising package would cause a decrease in response? Shouldn’t the model pick up the correct behaviour for packages without enforced monotonicity? Are we not just making the model predict what we want it to predict? It is certainly true that monotonicity should not be enforced without a very good reason; in our case, it is because we know how package level can impact the score by which we rank adverts. It is also important that we compare model performance with and without monotonicity. When doing this we found that only a small minority of predictions violated our assumption. Crucially, the accuracy of the predictions was nearly identical.
Model Architecture
Having chosen LightGBM as our machine learning model, we can now discuss our input features and the format of the predictions.
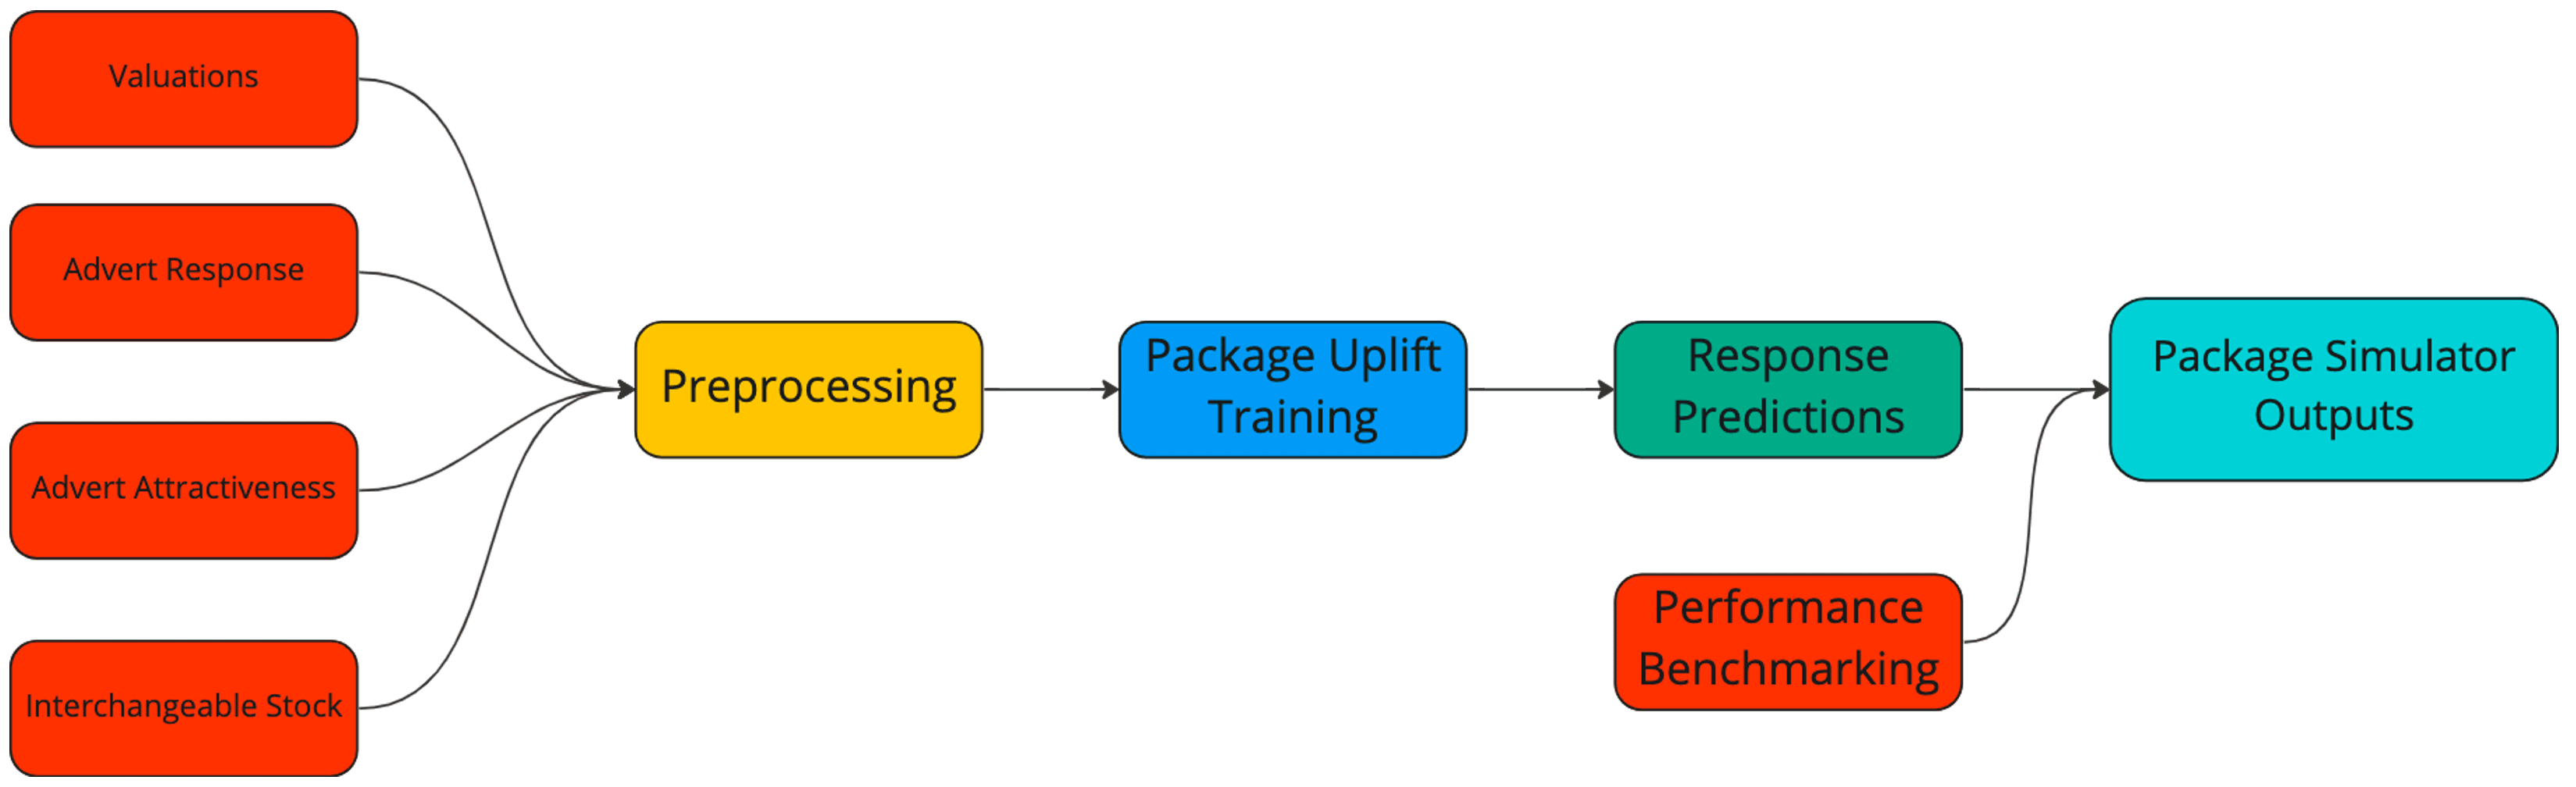
Package Uplift started out as two separate models. One predicted the number of search appearances and the other full-page advert views. A full-page advert view is generated when a user clicks on one of the search results, taking them to the advert’s main page. We take the logarithm of both, as adverts can receive anywhere between a handful of events per day to many thousands and we are mainly interested in proportional accuracy (i.e. within x% of the true value), rather than absolute accuracy. If we worked in absolute terms the model would solely prioritise the few adverts with huge amounts of response, to the detriment of all else.
Both models have the same input features, only differing in the target variable (search or advert views). We represent the type of vehicle being advertised with our interchangeable stock vectors (which we have a post about here) and the overall quality of the adverts with our advert attractiveness score (see our most recent post about advert attractiveness here). Naturally, we also include features around pricing using our in-house valuations and details of the advertised location of the vehicle. Finally, we include the stock’s current package level.
Each day we train the model using fresh data and generate predictions for all eligible advertised cars on Auto Trader. For each advert we predict the number of advert views and search appearances it would obtain on each of our five packages. This matrix of predictions is what we use to monitor package performance internally.
The final step is to generate the data used in our Package Simulator tool for customers. For this, we convert the predicted response into a Performance Rating score. Performance Rating is a metric that is familiar to customers at Auto Trader, and its main purpose is to provide a single metric that puts a customer’s performance into context. For each customer, we compare the response their adverts are getting to what we would expect from other comparable adverts on the site. Performance Rating informs the customer if their stock is under- or over-performing compared to other comparable stock on Auto Trader.
Since Performance Rating is a percentile-based score, we must compute the advert’s new performance rating as if it had been on a different advertising package. Care must be taken so that the predicted performance rating for the advert’s current package is the same as the current actual performance rating. To ensure this we measure the change in performance to be relative to the current advertising package. Once we have the predicted performance ratings for each advert a customer has, we aggregate all of them together in an interactive tool, which shows a customer the predicted spread of performance ratings they would have on each package.
How It’s Being Used
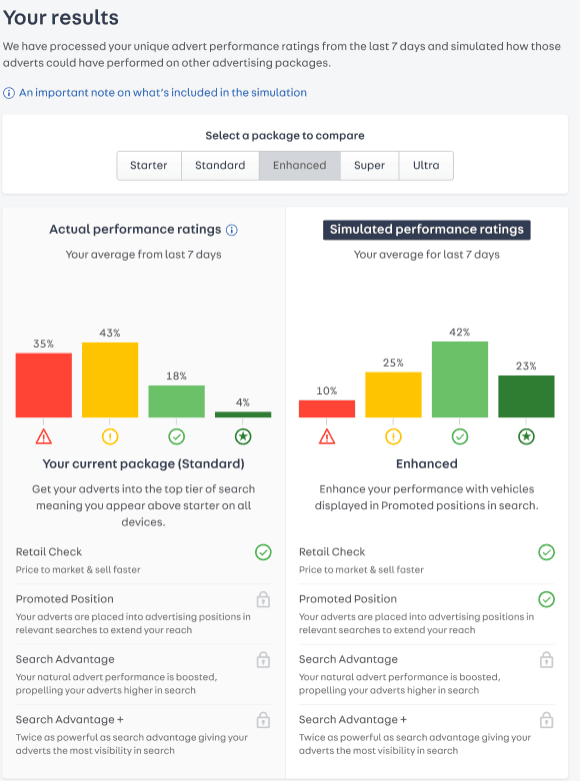
For Auto Trader, it is important to be transparent with our customers so they can choose the right package level for them. The performance of our advertising packages is available to our customers through Portal. This is where we show customers how their own individual performance can be expected to change if they were to upgrade or downgrade their package level. Due to the complexity of our machine learning models, we present our customers with the performance ratings described above. For interpretability we bucket the performance rating score (scaled 0-100) into four buckets, namely: Low, Below Average, Above Average and Excellent, based on the thresholds of 0-25, 25-50, 50-75 and 75-100 respectively. We then present the interactive graphs above for each package level, showing the proportion of a customer’s stock in each of the categories. As their package level increases, a customer can expect their stock to shift favouring the higher performance rating bands, and we know that a higher Performance Rating score correlates with faster sales, therefore increasing revenue for customers.
Summary
In this post, we have described how our Package Uplift model works and how we report those predictions to our customers. Package Uplift is only possible due to our other models already in production, and represents an exciting step for us where we now have a hierarchy of machine learning models that build on one another.
Great care has been taken with Package Uplift to ensure the predictions make sense with respect to our package mechanisms. After a lot of testing we have confidence in the model to use it internally to continually monitor the performance of our packages, ensuring they are performing as they should be. We also make our predictions available to customers to aid them in making decisions around their advertising package level.
If you are interested in finding out more about our Package Uplift model we are writing a second companion post to this. In it, we will cover how we have iterated on and improved this model since it has gone live, as well as how we monitor its performance, so check back soon!
Enjoyed that? Read some other posts.
Related Posts
15 Aug 2024—Tom Armitage & Dustin Hayden
Image source: Wikimedia Commons.
The Bayesian approach to A/B testing has many advantages over a Frequentist approach. However, there are some drawbacks. This post discusses these challenges and our attempts to overcome them.
14 Aug 2024—Tom Armitage & Dustin Hayden
Image source: Wikimedia Commons.
Websites are constantly changing. Here at Auto Trader, we use A/B testing to monitor the impact these changes have on the user’s experience. Fundamentally, we need to gather sufficient evidence to make a decision...
04 Jul 2024—Mahmoud Oshagh
Photo by Eugenio Mazzone on Unsplash.
Have you ever stumbled upon something that just completely captivated your attention? That was precisely what happened to me when I first came across Large Language Models (LLMs). It was during...
31 May 2024—Tom Armitage & Tom Kelly
Image source: Wikimedia Commons.
There has been great advancement in recent years in the field of image classification. With pre-trained models readily available and mature libraries making the process of developing and training your own models easy, you...
05 Oct 2023—Tim Summerton-Brier, Stevie Woods, John Harrison
Photo by Tico Mendoza
Back in April, Auto Trader gave a few of us the opportunity to attend Data Council 2023 in Austin, Texas, USA. Data Council is an independently curated conference that covers many aspects of working...
17 Apr 2023—Olivia Pennington & Tom Armitage
Photo by Nik Shuliahin on Unsplash.
You’ve done the hard work in researching, developing and finally deploying your shiny new Machine Learning (ML) model, but the work is not over yet. In fact it has only just...
