Life Cycle of Our Package Uplift Model

Photo by Nik Shuliahin on Unsplash.
You’ve done the hard work in researching, developing and finally deploying your shiny new Machine Learning (ML) model, but the work is not over yet. In fact it has only just started! This is the second part of our series on our Package Uplift model, which predicts how well our customer’s stock will perform on each of our advertising packages. We will discuss how we monitor and continuously develop our machine learning models after they have been designed and deployed to reflect the current market. See part one of this series for how we created Package Uplift.
Model Monitoring 
As with all of our machine learning models at Auto Trader, it is important we monitor the performance of the model to ensure that the machine learning technique and application are appropriate and accurate as our data grows and the market changes. In order to do this we use an external tool called MLflow. MLflow enables the tracking of parameters, metrics and model artefacts related to machine learning models. It allows us to easily compare different versions of a model, something that is particularly useful during the development phase in a model’s lifecycle. At Auto Trader, we are constantly evolving our model suite, and by using MLflow we have the ability to deliver iterations efficiently and accurately.
Databricks offer an MLflow tracking component, which allows us to track model metrics and parameters such as the vehicle channel and package level with the following lines of code:
mlflow.log_param('channel', 'CARS')
mlflow.log_param('package_level', '3')
The tracked metrics are then stored in Databricks within an MLFlow experiment, tracking every logged run of the model, as seen below.
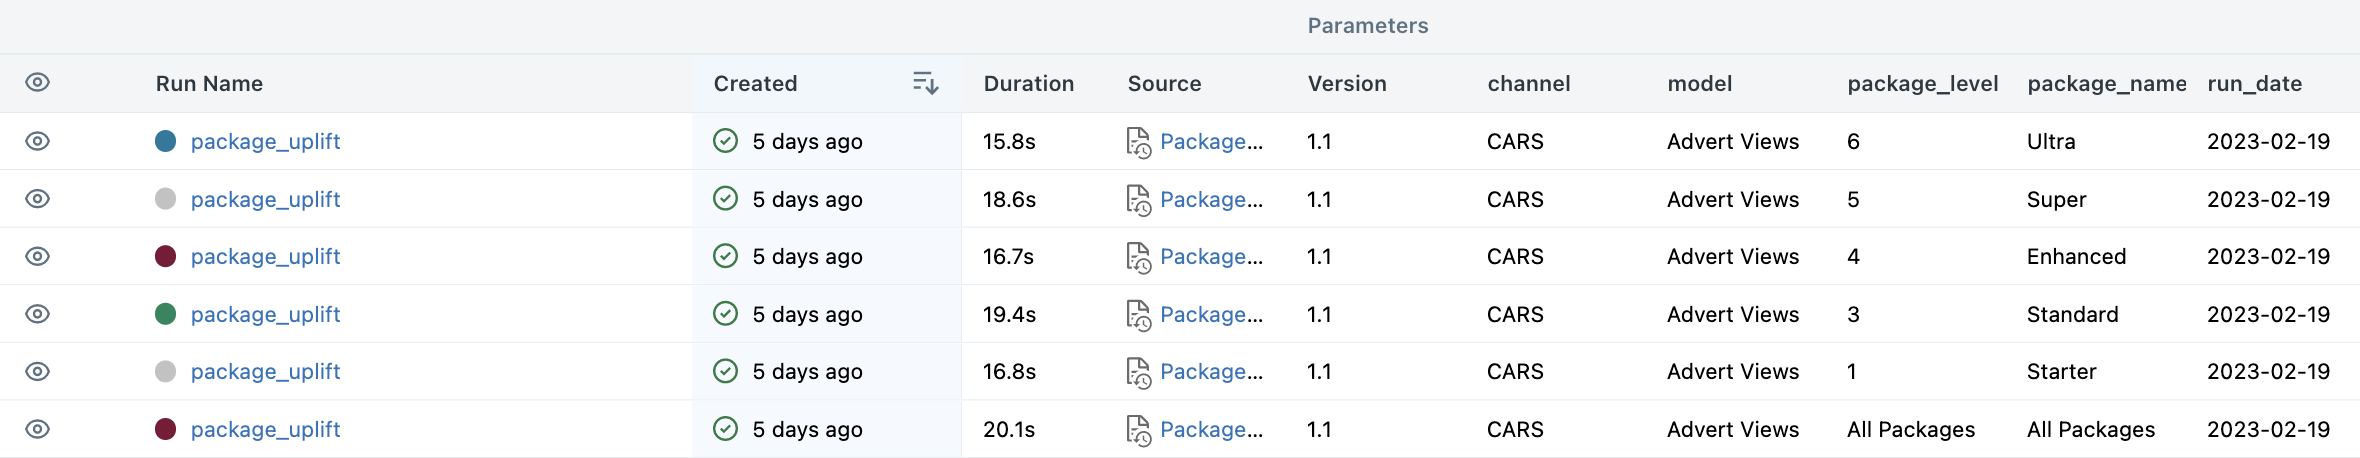
For the Package Uplift model, we use Databricks to track metrics such as root mean square error (RMSE), mean absolute error (MAE), and mean absolute percentage error (MAPE), along with data volumes and run dates. Once we have metrics stored within MLflow we can compare runs of the experiment against one another. Databricks MLflow tracking offers a built-in plotting tool to compare runs of a single MLFlow experiment. Alternatively, the following API command will load all metadata for the specified experiment as a pandas DataFrame.
mlflow.search_runs(experiment_ids='999')
This allows us to produce custom plots and summaries of the model’s performance. For more information on using MLflow within Databricks see documentation here. In the case of Package Uplift monitoring, we can look at daily metrics and plot the trends. This allows us to easily detect if there is a deviation from the normal distribution of our metrics and investigate appropriately.
Iterations of Package Uplift Model
Since the Package Uplift model went live, we have been working on multiple iterations. During each testing phase of the iterations, we have utilised MLflow within Databricks to make informed decisions about whether the change is appropriate.
The Package Uplift model is written in Python using Pyspark and is published to a private Python package repository. The pipeline code can then be installed into Databricks notebooks for development using the command %pip install --index https://pypi.example.com artifact-name. The model is designed as an ETL pipeline, meaning that data processing and model training is split into three main steps: Extract, Transform and Load. Having this structure in our models means that it is very easy to make changes to the models without having to edit lots of code. For example, if we wanted to test a change where we remove a feature from the model, we can amend the single transform function that defines the feature list and selects the columns from our source data. This iteration of the pipeline can then be executed in a notebook and tracked with MLflow.
Having both efficiently packaged model pipelines and the ability to track our model’s performance with MLflow allows us to easily test a change and validate performance compared to the current production version. This speeds up our end-to-end process of prototyping changes to pushing to production.
Incorporating Van Stock
Currently, the Package Uplift model is trained on stock advertised on Auto Trader’s car platform. This means only our customers who are selling cars have visibility of the package simulator tool, shown in our previous blog post. We have recently been prototyping a new version of the model that will include van stock in the training data and therefore be able to produce predictions for both our car and van advertised stock. We can then provide insight to more customers advertising on our platform.
During this project, we had to think carefully about how we combine cars and vans into a single model. The nature of the van market is predominately for commercial purposes and our pricing for this vehicle type is exclusive of VAT. When modelling, we avoid introducing any bias by ensuring we are excluding VAT in our pricing feature for the purpose of training a model with both cars and vans included in the same training set.
The Package Uplift model contains features derived from other machine learning models built at Auto Trader, including our interchangeable derivatives model. This predictive set of features gives us a way of measuring how similar stock items are to one another at the derivative level, based on vehicles being viewed in the same session by our users. This model, too, was originally trained on cars only, so we extended this to cover vans to enable us to extend Package Uplift.
We initially tested building two independent models since cars and vans are different vehicle types. However, it is beneficial to have the ability to compare cars to vans, particularly when considering crossover stock. A crossover vehicle is defined as a vehicle that can be advertised on both our car and van channels, typically identified as small vans, for example the Volkswagen Caddy or a pickup truck. Given that users can and do look at both vehicle types when browsing our website, we can identify which combinations of cars and vans are most viewed together. If we were to have two independent models we would lose this ability to compare across different vehicle types. For this reason, we validated that there was a minimal loss in errors by combining car and van into a single training set vs having two independent models. We also validated that the model has the ability to produce sensible pairs of similar vehicles, with the majority of cars and vans being clearly distinct sets of objects. Some examples of similar predicted vehicles are shown below.

Photos left to right by Igor Lypnytskyi, Dardan Motors, Stephen Leonardi and Bradley Dunn, all sourced from Unsplash.
As with the interchangeable derivatives model, we also tested if the Package Uplift model would achieve higher accuracy as two separate models: for car stock and van stock. Given that there was no significant difference in our error metrics in MLflow, we remained consistent with a single Package Uplift model trained on both vehicle types.
Additionally, from a product view, Auto Trader offers one selling package per customer. If a customer has both car and van stock, they would not be able to advertise their cars on Ultra and vans on Standard. Therefore there is no need to treat vehicle types as being strictly independent.
To include vans we also had to change the features we feed into Package Uplift. Another feature of the Package Uplift model is Advert Attractiveness, which is calculated by channel. Typically, for most vehicles advertised on Auto Trader, the stock item will have a single Advert Attractiveness score for the channel it appears on. However, for crossover stock where the vehicle can appear on both the car and van channel, there are two corresponding Advert Attractiveness scores. To work with two attractiveness scores for crossover stock, we produce separate predictions for both car and van channels, which we then add together and combine into a single stock item.
Natural Uplift Model
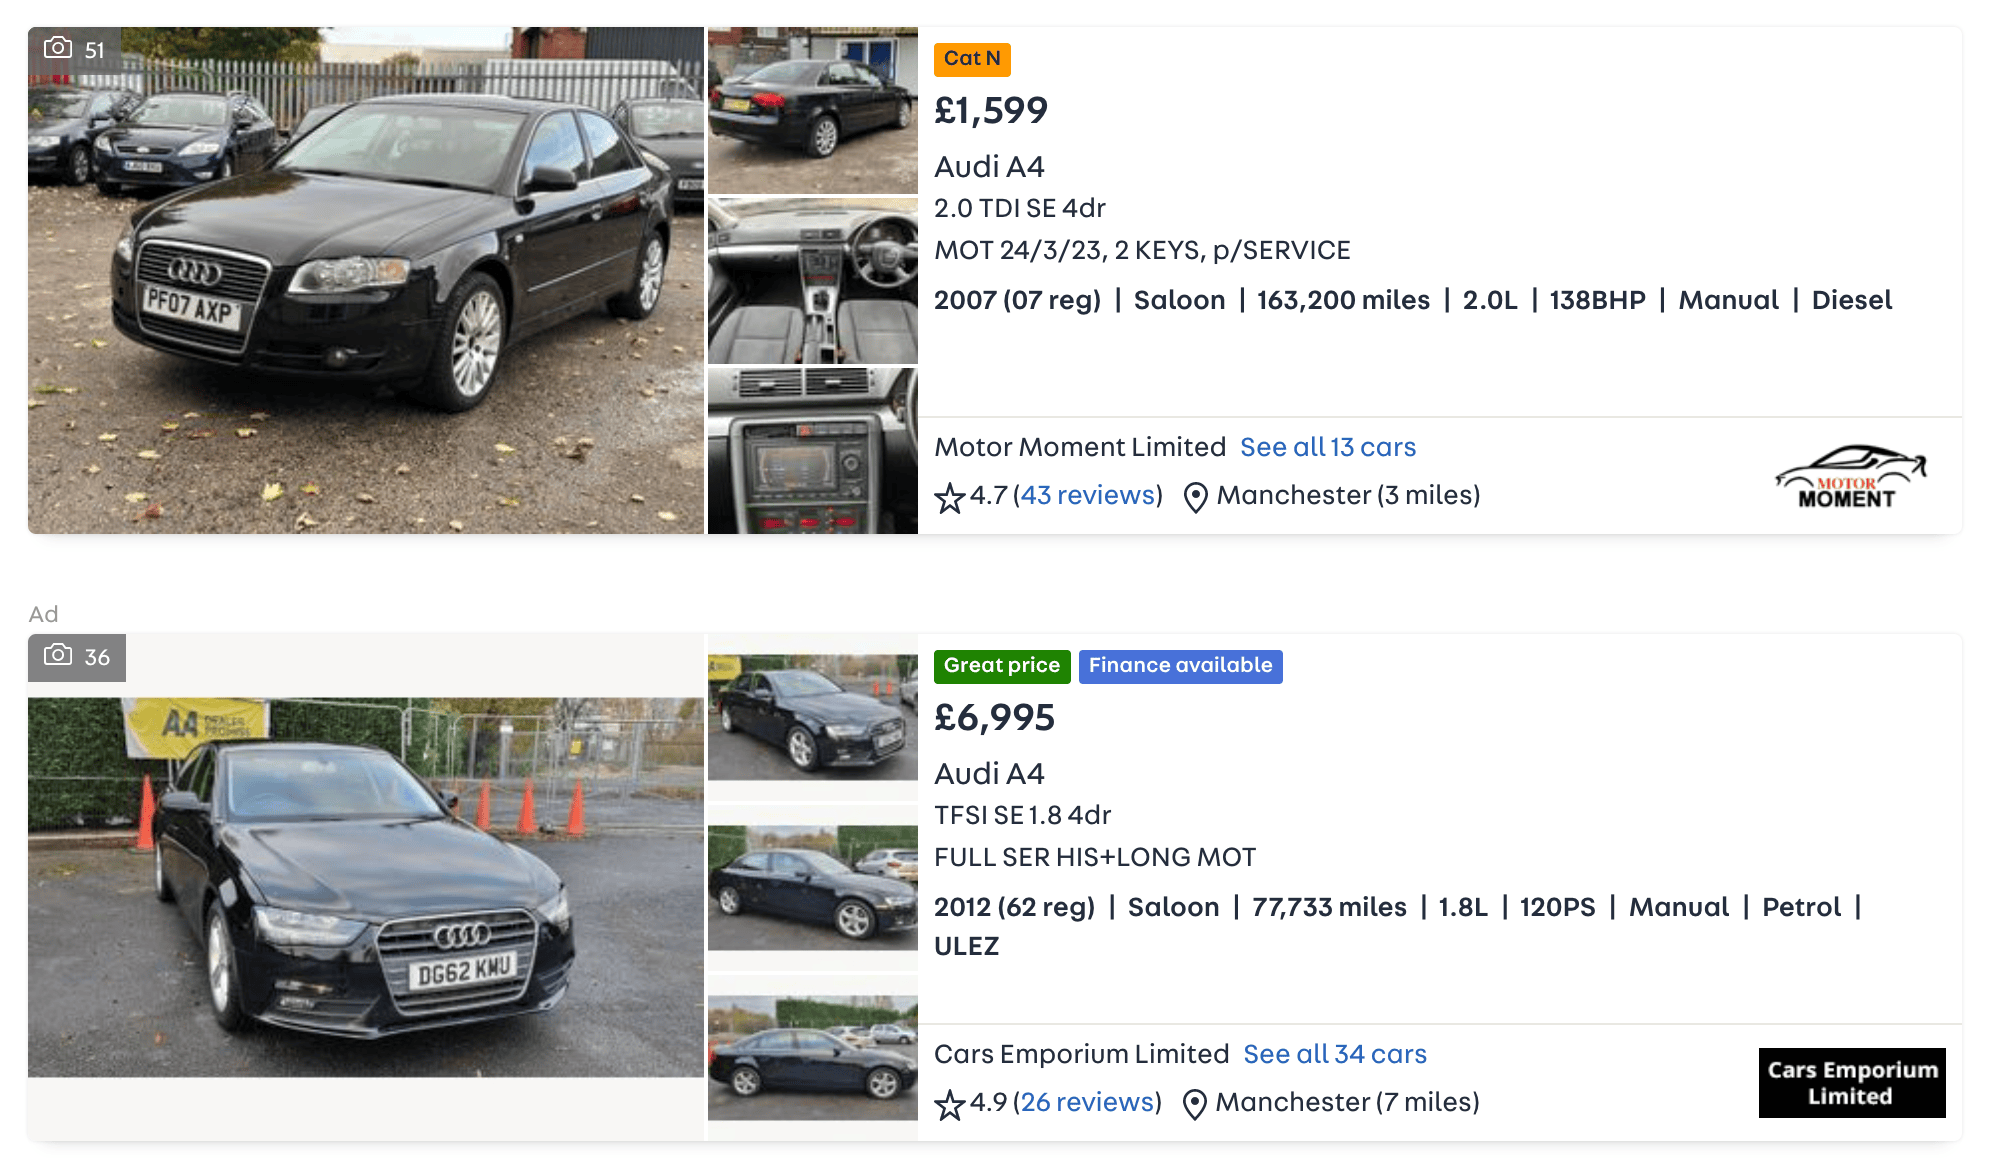
At Auto Trader, our selling packages directly influence a customer’s performance of Promoted positions within our search results. The figure above shows an example of the Promoted position, identified with Ad above the listing. The other listing position is referred to as a Natural listing position, which is a standard advertising position on our website. By upgrading to a higher package level, customers can have a performance boost through the Promoted position. The original aim of the Package Uplift model was to calculate the additional uplift gained by changing package level and therefore considered the uplift of the Promoted position. In order to calculate this uplift, the training data includes both Natural and Promoted position events.
In the case where we see some fluctuation in the model uplifts, being able to split out Natural and Promoted positions is helpful for diagnosing the cause of these fluctuations. By having a view of the natural variability in Natural listings across the package levels, we can isolate the effect of true package performance within the Promoted and Natural version of the Package Uplift model. This allows us to be more transparent in the model monitoring, so we can quickly adapt to change if required. Hence, we have developed a Natural Only Search Advantage model, as an extension to the Package Uplift model.
The modelling choice is the same as the original Package Uplift model, where we filter the training data to events that come only from the Natural search positions. Similarly to adding van stock, this change has been easy to make since the pipeline is written so that it only requires a single function to be edited.
Summary
In this post, we have covered how we track our Package Uplift model’s performance metrics using the MLflow capability within Databricks, along with improvements made since the model first went live such as including vans and a Natural only variant. The careful considerations around the Package Uplift model have led it to be the trusted and accurate model it is today, giving us valuable insight into how our package products work in search, and more importantly, providing direct insight to our customers. This transparency is something we value and strive to improve upon.
Our next step with this model is to fully embed the predictions for van stock into our customer-facing Package Simulator tool, where our customers will then be able to access their stock performance on both their car and van vehicles.
There are more improvements in the works already, such as incorporating stock items that are available for click-and-collect or home delivery instead of only being available at a physical dealership. We will also be looking at further streamlining the process of productionising changes we make to the models.
Enjoyed that? Read some other posts.
Related Posts
15 Aug 2024—Tom Armitage & Dustin Hayden
Image source: Wikimedia Commons.
The Bayesian approach to A/B testing has many advantages over a Frequentist approach. However, there are some drawbacks. This post discusses these challenges and our attempts to overcome them.
14 Aug 2024—Tom Armitage & Dustin Hayden
Image source: Wikimedia Commons.
Websites are constantly changing. Here at Auto Trader, we use A/B testing to monitor the impact these changes have on the user’s experience. Fundamentally, we need to gather sufficient evidence to make a decision...
04 Jul 2024—Mahmoud Oshagh
Photo by Eugenio Mazzone on Unsplash.
Have you ever stumbled upon something that just completely captivated your attention? That was precisely what happened to me when I first came across Large Language Models (LLMs). It was during...
31 May 2024—Tom Armitage & Tom Kelly
Image source: Wikimedia Commons.
There has been great advancement in recent years in the field of image classification. With pre-trained models readily available and mature libraries making the process of developing and training your own models easy, you...
05 Oct 2023—Tim Summerton-Brier, Stevie Woods, John Harrison
Photo by Tico Mendoza
Back in April, Auto Trader gave a few of us the opportunity to attend Data Council 2023 in Austin, Texas, USA. Data Council is an independently curated conference that covers many aspects of working...
24 Mar 2023—Tom Armitage & Olivia Pennington
Photo by Stephen Dawson on Unsplash.
Advertising packages are the core product at Auto Trader. Depending on the package tier our customers purchase, they get to appear in...
